There are many regional proxies from around the world that do show the existence of a warm period (warmer than today in most places) called the "Medieval Warm Period" or "Medieval Climate Optimum" roughly from 900-1350AD and a "Little Ice Age" roughly from c.1450 to 1850AD.
Amongst the strongest evidence of this is a study done by Dr Lloyd Keigwin of Woods Hole Oceanographic Institute in 1996. The study was done in the Sargasso Sea near Bermuda, and involved an area of sea bed which had a very high rate of sedimentation (paleoclimatologists like such areas because they can produce high resolution sedimentary information) and a particular species of plankton called Globigerinoides ruber.
G. ruber has the interesting property that it "lives year-round at the surface of the Sargasso Sea, and it happens to deposit its calcium carbonate close to oxygen isotopic equilibrium with seawater. This means that G. ruber is ideal for reconstructing past changes in the temperature and salinity of Sargasso Sea surface waters"
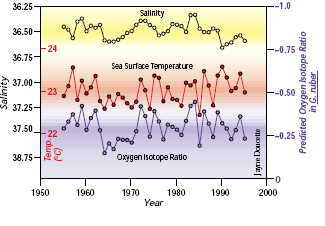
This leads to a direct temperature record of the surface of the Sargasso Sea for the last 3000 years in high resolution form. Because it deposits its calcium carbonate close to the oxygen isotopic equilibrium and that this equilibrium is temperature-sensitive, such a record can have an actual temperature assigned to it to good accuracy, as the figure below illustrates:
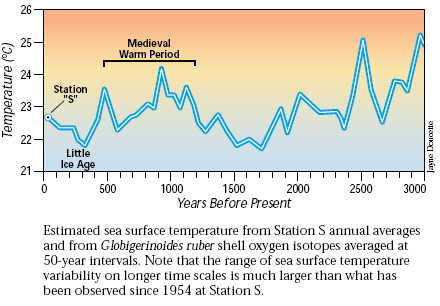
Note that not only can the Medieval Warm Period be seen, around 1000 years ago and the depths of the Little Ice Age around 500 years ago, but also the Dark Ages cold period (1700 years BP) and the Roman Warm period (around 2000 years BP) and other warm periods at 2500 and 3000 years BP.
An overview article of this study was published in Oceanus and can be found here. If you want a copy of the technical report sent to Science then e-mail me via climateaudit AT gmail.com and I’ll send you a copy.


23 Comments
This is actually quite an old paper but still seems remarkable. Someone might correct me but I’m not aware of any criticism of it comparable to MBH98. Why is this? It relates to a small part of sea but as most of the planet is covered by water it seems a good place to start. If this is representative of past temperature globally it demolishes the hockey stick. Have studies like this been done elsewhere?
Re: #1
As I said, there are a lot of proxies from right around the world, and this happens to be a particularly clear example, which could conceiveably be a proxy for the world. I don’t think any study “demolishes the Hockey Stick”, rather that the methodological flaws of the Hockey Stick invalidates itself as reliable science. The attachment given to the one reconstruction despite its flaws, is to me a clear religious attachment, which is why its detractors are treated like heretics and apostates from the True Belief(tm).
Since the proxy comes from a known area which receives most of its input from the Gulf Stream, and from that, the waters of the tropics, I think its safe to say that this is not a “Northern Atlantic Basin only” proxy, but something much more applicable to a larger scale. I conversed with Dr Keigwin and there are other studies which show a similar effect, and I shall be digging them up in the near future, rest assured. Dr Keigwin himself was pretty certain that the Little Ice Age really was a global event, but that the MWP was, in his view, more controversial as a global event. He remarked that the cold periods appeared to be robust as global events, but the periods in between, less so.
John, I was being a little tongue in cheek. I was very naàƒ⮶e when I first started looking at climate science. Coming from an engineering background I was used to ideas being more firmly grounded. What has surprised me is that in climate science nothing is ever quite what it seems. I thought at one stage some sophisticated science was being used to figure out historic temperature from tree rings but unless I’ve missed something we are just talking abut the ring width processed with some fancy maths, which M&M have shown to be of dubious merit. At first I thought data from the ice cores was easily and unambiguously extracted but again as Prof. Zbigniew Jaworowski shows there are huge technical problems and unsubstantiated assumptions that are made in the process.
The paper from Dr Lloyd Keigwin in comparison looks very straight forward but it too must have some underlying assumptions and processing. I was wondering if anyone had subjected it to the scrutiny that you are trying to bring to bear on MBH. If this paper was very publicly audited and replicated, then shown to be good and valid science it might oblige MBH to put up or shut up. As it is they are just ignoring the elephant in the room.
John replies: Wouldn’t it be interesting to do precisely that!
Hummmm, here we have *one* proxy that, well I never, shows what people here want and it’s being touted as something ‘which could conceiveably be a proxy for the world’.
Yes we have *mutliple* proxy reconstructions which show the wrong things which are dismissed. Can some explain why this one proxy can reflect the world but not any or the proxies in the Moberg05 record? Whcih other single proxies ‘could conceiveably be a proxy for the world’?
Oh, and since I’m bound to be accused of trolling becuase I’ve asked questions, let me also say I think that MBH99 isn’t the last word in past climate reconstructions.
John replies: Those "multiple proxy records" use the same proxies (and frequently the same few people!) which have been shown to be unreliable to reconstruct temperature.
The Moberg05 record, has a few proxies within it which also come from the same flawed set as all the others. Nevertheless, the Moberg05 record does show a Little Ice Age with a lowest point in 17th (not 19th Century) and a Medieval Warm Period 900-1000 years ago, something that MBH99 lacked. It’s not a numbers game, but if you wish to play numbers, there are some 240 proxies from around the world which show similar features and ONE which does not.
As far as Keigwin 1996 is concerned, it is an interesting proxy study which is based far from land-based influences and has high resolution. I said only "conceivably" a proxy for the world. It is certainly not a "Bermuda-only" proxy, since its inputs are oceanic in scope.
The problem I have with multiproxy studies is its very difficult to compare proxy apples with oranges, and contruct a meaningful single record from both. You seem to forget (or ignore) that multiproxy studies are agglomerations of regional proxies, and that the statistic treatment of the principle components, like bristlecone pine records are very much subject to the statistical weighting given by the authors’ computer programs.
Peter, I am not suggesting that we base all our future thinking on any one proxy. I was just trying to compare the work of Keigwin with that of MBH. Keigwin seems relatively simple to understand and I would have thought simple to audit and replicate. In MBH not only do we have a large number of different techniques employed but then a lot of clever maths to make sense of it.
I simply find it odd that the Keigwin study is unchallenged given that we are told that 75% according to von Storch (and virtually all according to Sir David King) climate scientists have no doubt that mankind has caused recent warming. I would have thought it a feather in cap for some upcoming or little known climate scientist to expose it as defective. Just as the Hockey stick is a totem for AGW so Keigwin seems to be for sceptics.
“there are some 240 proxies from around the world which show similar features and ONE which does not.” Which are the 240 which is the 1?
Which is a more accurate picture of past events, the one or the many.
Assume that each proxy type and location can be analyzed relative to time. You then need to have a way to calibrate the time scale. For each proxy you wind up with a reasonable picture of what it has been subjected to. If it is tree ring growth then you have a chart of favourable/unfavourable growing conditions. Absent any other indicator in the same location there is really no solid way of determining which factor(s) is/are being represented. Only the final result is available.
If you wish to combine results from various locations you need to syncronize the time to better than one year as that is the resolution of the record. If you are off by a year or more then the results are smeared into meaningless noise. If the trees are living at the time of sampling or the year the tree died is accurately known (ie. it was cut down in March of 1899) then accurate dating is possible. If the tree died at an unknown time then accurate dating to 0.5 years is not possible. The resulting data can be processed and analyzed for trends but should not be a candidate for any multiproxy calculation.
These are simple concepts that can be applied to any proxy. Time syncronization and smearing of data are well understood in the fields of Engineering. If they were not, the Internet and this web site would not be possible. In Engineering, we also understand that the result of any calculation can NOT have more precision than the least precise input data.
Re #7. Why do you say you can’t use a dead tree if you don’t know when it was cut down? There are well known patterns in tree rings due to things like Volcanic eruptions in the area or regional doughts or the like. This makes it possible align a tree without a known end point.
re: #8
That’s exactly how the C14 curve is calibrated, using wood from old buildings and fossil trees
There are known issues with dendrochronology. Primarily, trees respond to a range of different stimuli not all of which necessarily correlate well with average annual temperature. This subject has been discussed at various times on this site. It is also quite possible that trees react differently to different combinations of stimuli. Some recent papers have focused on the density of the last part of the tree ring, and have claimed that this correlates well with temperature, but I have not yet seen any evidence for this assertion. Note that I do not imply that there is no such evidence, only that I cannot (yet) form an opinion based on evidence for the assertion.
The primary advantage it seems to me of dendrochronology, and its attraction in paleoclimate reconstructions, is the potential high resolution afforded and the widespread nature of the “records”. Not all proxy sources offer yearly measurements,and as I understand it, Moberg uses tree rings at least in part for that reason.
There can be other sources of error with trees as well, a good example is the Huon Pine records from Tasmania, where the records themselves were calibrated against potentially faulty and misleading temperature records. In in all, I continue to have doubts about the usefulness of dendrochronology as a source of detailed data on prehistorical temperatures. It can be used I suggest as a broad indicator, but with numerous caveats and especially no special selection of records showing “the clearest signal”, as the question must be, signal of what.
Re #7 and #8
The exact year when the tree died is unknown in practically all cases in all tree ring series before they have been compared wihth each other. In Finland there was for some time a situation were a “super”long time series of may be 6000 years or more could not be completed because we had no overlap during a 100-200 years interval before about 100 y BC (I don’t remember the exact figures). The old series was completed year by year but could not be connected to calender years before the missing overlap was found. After that it was fixed.
If you find a dead tree somewhere and look at the annual growth it is quite easy to detect the year of death by comparing with a living trees.
In case the tree was infected with fungi the exact year may be uncertain but you can still use fixed calender years until it was infected, the year of which is usually visible.
I am quite sure that this calibration is correct in existing archived tree ring series.
The most important problem is actually that already mentioned by Steve: The variation in annual growth is not reflecting temperature variation in such a way as has been expected in many reconstructions.
I have an impression that tree ring data combined with annual lake sediments (giving data on snow melting an precipitation) from the same region could be more informative. But here we have a new problem: lake sediments are disturbed by cultural history from about 1700 AD. The combination is difficult to calibrate with recent temperature measurements.
Larry Huldén, Finnish Museum of Natural History
Dave, If the unique patterns in nearby trees are clear and their dates are accurately known then you could use those trees. The further apart the trees are from each other, the greater the chance that they did not experience the same conditions at the same time. It only takes 0.5 years difference to start smearing the data. If you are aligning based on drought patterns, how do you use the rings for temperature? Using tree rings for temperature indications presumes that temperature is the dominant signal and that other factors are limiting.
Re John’s comments in #2 that the ever-popular Sargasso Sea data "could conceiveably be a proxy for the world," it’s worth noting Keigwin’s more recent work, from a site off of Nova Scotia[1], that shows no Medieval Warm period. I’m not suggesting this shows that there wasn’t a Medieval Warm period. It merely illustrates the risks of trying to generalize globally from a single site.
[1] Climate Dynamics (2003)21: 53–62
John replies: Absolutely. When I conversed with Dr Keigwin on this matter, he told me that the North Atlantic is much more complex because of changes that occur in the North Atlantic Oscillation over long periods. Nevertheless, there are clear evidences in the Greenland and Antarctic Ice of increased dustiness in the atmosphere, which occurred within a few years of each other around 500 years ago. This dustiness is associated with the expansion of deserts, which happens during global cooling events. Since the dustiness happens on opposite sides of the world, its difficult to imagine this not being caused by a global climatic change. As I mentioned earlier, Dr Keigwin did opine that the warm periods were less well established than the cold periods.
Keigwin’96 Sargasso has been a proxy favorite of mine (even before MBH’98), one of the more interesting I’ve studied — I’m old school; my Climatology course work was post-graduate in the late 70s, when another ice-age was the threat? Because of its unique oceanographic position ((NW) Sargasso is near Gulf Stream), this ocean gyre with GS eddy mixing offers a very tempting proxy to generalize beyond its locality. I actually posed the question of why it wasn’t used in MBH’98, ’99 and IPCC’01 TAR (Dr. Mann’s lead author Section 2) at RealClimate, post 89 of http://www.realclimate.org/index.php?p=74
You can read Drs. Schmidt and Mann’s response, as well as their response to a (Monnin study) CO2 lagging indicator question that I posed. Note: my 2nd question asking who was the astro- (or better a solar-) physicist on their advisory team, was ignored — again my old school background, a degree in Physics (and another in Mathematics). I have to say I was pleased with their quick response to the other questions — though somewhat unsatisfied at the content.
This interaction did much to form my opinions of their selectivity — I still feel the MBH proxy exclusion filters were set on “ULTRA-NARROW PASS” from 1997-02 for them to omit this powerful Science-Nov’96 paper. It was their choice and MBH’98 was near completion (and possibly submitted), when Keigwin’96 was published. But if it wasn’t referenced in MBH’98 (no time at submittal), it should have been in MBH’99; if not MBH’99, then it certainly deserved a high profile position in Dr Mann’s TAR Section 2? But as already noted, it is a powerful contra-indicator of no MWP or LIA. It appears (M)BH finally got around to formally addressing Keigwin’96 around 2003 … about the time they were developing Corrigendum’04, give or take a month? NOTE: and no, I’m not trying to imply the two events are linked — more that they were very busy at the time.
Epilogue: Moberg’95 got it right, by including Keigwin — no surprise, Moberg’05 also exhibits a significant MWP and LIA! With that in evidence, one might speculate whether MBH regrets their late consideration of Dr. Keigwin’s work?
Correction: Dr. Mann did address and reject Keigwin’96 in the IPCC TAR Chapter 2, using Keigwin and Pickart’99 Newfoundland (a proxy with cooler MWP and warmer LIA) to offset it with an North Atlantic Oscillation argument. Would it be too cynical to assume that if MBH had a choice of only one Keigwin proxy, we know which they would choose?
Steve: No , it wouldn’t be too cynical. Julian Sachs has some interesting papers in this area as well.
This study of course is included in Mann’s metanalyses, no?
Re: 13 … Keigwin’s opining LIA was more pronounced than MWP — Figure 4 of his 1996 paper did show significant evidence of MWP around 1100. Obviously I can’t contradict your direct discussions, but the MWP plot evidence was not modest.
Regarding next broadcast of LIA on the History Channel, is at 17:00 on 26-NOV (Saturday).
http://www.historychannel.com/global/listings/series_showcase.jsp?EGrpType=Series&Id=16021920&NetwCode=THC
NOTE: As part of the advertising teaser, the claim is it (the LIA) “decimated the Spanish Armada!” Oh well, looks like hyping the local WEATHER event impact of a changing global CLIMATE can happen on both ends of the temp scale.
Will we soon see a thread on how the show actually supports MBH’98 and ’98 on RC.org?
An interesting set of things regarding Sargasso. Oceanographically, I would have to say that the relative calm in terms of currents there has likely been a persistent feature since the closure of the Isthmus of Panama. So we are talking pretty much the breadth of the Quaternary. In the atmosphere above, the Bermuda High is a persistent feature. I cannot think of a better place for recording long term climate effects.
We have several proxies from Finland showing that Medieval Warm Period was about 1 dergree centigrade warmer than current warm period (Ojala etc). E.g “oakbelt” was about 150 km northern than today (Leena Hulden). And in Lappland trees were growing 80 km more north than nowadays. Last week (sept. 2006) a group of specialists (rings of trees) from several countries were in Lappland and there said human made global warming is not true or issue is too simplicated. E.g Jan Asper from Switzerland can show proxies from Himalaya and Alps showing climater were in these areas about 1 degree centigrade warmer than in modern warm period.
Henrik, see here 😉
UMM…
Good morning, could you give me the source of the above figure showing the Sargasso Sea Surface Tempratures for the past 3000 years as well as the top figure showing sea surface temperatures and oxygen-isotope-ratios from 1950 to 1999? Would appricate it. Thank you. John Mertens