IPCC AR4 is online – thanks to readers for pointing this out. I didn’t notice any press releases or hoopla. The lead author for the millennial paleoclimate section was Keith Briffa, who takes a realclimate line on the debate – surprise, surprise. Their comments on M&M are pretty much the same as in the Second Draft – they essentially disregarded the comments by Ross and myself, even on what we are supposed to have said. The Team features prominently in the chapter – a search on Mann turns up 92 mentions; Briffa 36 mentions; Jones 36 mentions;
Like Mann before him, Briffa used his position as Lead Author to publicize his own work – I don’t know whether this sort of behavior is prevalent in other chapters, but it’s something that is a risk when authors are parties to controversy, something that I and others (von Storch) criticized in the past. The spaghetti graph in Box 6.4 of Chapter 6 here is taken from the series in Osborn and Briffa 2006. Curiously, although these are exactly the series in Osborn and Briffa 2006, they do not mention this article, instead attributing the series to “proxy records collated from those used by Mann and Jones (2003), Esper et al. (2002) and Luckman and Wilson (2005)”. If you look closely at the right hand side and I’ll discuss this further, you can see a few proxy-series that peak in mid-century and close at low levels (the Divergence Problem) and a few that close at high values – the high closers are Mann’s PC1 – which, despite all the publicity, reappears here bold as brass, a foxtail series and Yamal, like aged streetwalkers with too much mascara.
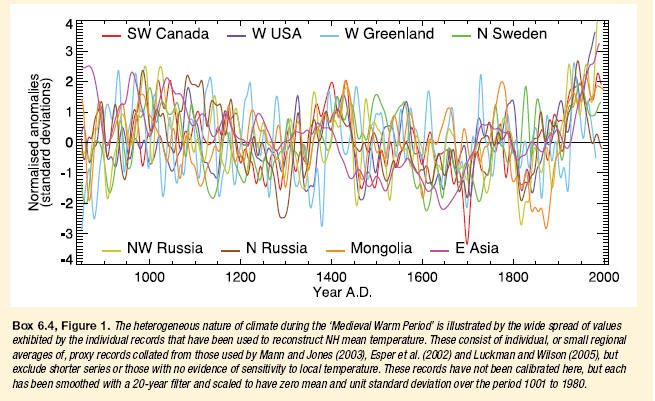
Box 6.4, Figure 1. The heterogeneous nature of climate during the Medieval Warm Period’ is illustrated by the wide spread of values exhibited by the individual records that have been used to reconstruct NH mean temperature. These consist of individual, or small regional averages of, proxy records collated from those used by Mann and Jones (2003), Esper et al. (2002) and Luckman and Wilson (2005), but exclude shorter series or those with no evidence of sensitivity to local temperature. These records have not been calibrated here, but each has been smoothed with a 20-year filter and scaled to have zero mean and unit standard deviation over the period 1001 to 1980.
Update: This spaghetti graph is changed from the version in the Second Draft. Here’s a replication using data from Osborn and Briffa 2006. The two series with high closing values are Mann’s PC1 (innocuously called “W USA” by Briffa to distract attention from what it is) and Briffa’s version of the Yamal series. The two series which close below the long-term mean are: Fisher’s west Greenland composite (which essentially functions like white noise in a reconstruction) and Taimyr. The 4 series with intermediately high closes are: the Yang composite which uses among other things Dulan junipers and Thompson’s Dunde and Guliya ice core data (or at least one of the many versions of each); Jacoby’s Mongolia series; Tornetrask and Rob Wilson’s Jasper reconstruction. All these series have been discussed at length on previous occasions.

To show the PC1 and Yamal series, I’ve re-plotted this with the Mann PC1 in thick red; Yamal in thin red and other series in light grey. You can see that the rhetorical effect of this diagram depends strongly on these two series. In addition to the discussion of the Mann PC1, Briffa’s substitution of the Yamal series for the Polar Urals update has been discussed before.
The series that have been dropped from the illustration in the Second Draft (which were used in Osborn and Briffa 2006) are plotted below. There are 2 series with high closing: foxtails (which grow about 20 miles from the dominant bristlecone site, Sheep Mountain); the short van Engelen documentary series (which is not a “proxy” in the sense that tree rings are a proxy); one series with a slight positive close ( Tirol) and 3 series with negative closings (Chesapeake; Quebec and Mangazeja).


57 Comments
The ‘uncertainty guidelines’ found in the appendices make entertaining reading, given the IPCC’s track record:
Click to access AR4_UncertaintyGuidanceNote.pdf
As they said “scaled to have zero mean and unit standard deviation over the period 1001 to 1980” by doing this unit standard deviation trick you eliminate any possibility of showing any period as particularly warm or cold, it flattens all the series.
Both conclusions as well as the accent of formulations clearly depend on the lead author. If Steve were the lead author, they would be different. The lead authors are arguably politically chosen which is the main reason why Steve wasn’t the lead author. 😉
The “heterogeneous” adjective for the spaghetti graph is pretty entertaining. Moreover, the temperatures in the past look equally heterogeneous to me, and if they were more heterogeneous in the distant past, it’s simply because the uncertainties are expected to increase as you go to more distant events.
I wonder whether some people will say that this heterogeneous graph, for example, looks like a hockey stick. I am sure they will. 😉 But with their approach, everything is continuously connected to hockey stick. It’s just like the measurements of ESP phenoomena. It is OK to do the experiments more carefully than before and get a smaller effect, but the important permanent lesson is that the ESP effect – or a catastrophic future warming – is still there. If some misstep or misconduct is found, the important thing for the religion is to remove it continuously. 😉
I just read quickly through the Paleoclimate Chapter. This is embarrassing. Following the NRC and Wegman Reports, it seems bizarre to act as though the hockey stick has not been discredited. I did not expect to see the Wegman Report cited because it did not appear in the peer-reviewed literature. However, I am amazed that the NRC Report [2206] is referenced only in the introduction (as the last of a list of generic citations) and, with respect to the linearity of tree growth response, and even there only to say:
That’s it.
Is it the position of the IPCC authors that the central finding of the NRC report — the part that identified the flaws in MBH98 and MBH99 — could be ignored?
Good to see that Wahl and Ammann gets in there, even though they refer to it as either in 2006 or 2007 !
And I am delighted to see that they felt obliged to cite you and Ross ! How that must have stuck in the craw 🙂
As you say, their handling of the NRC report does reveal a tad of bias.
per
#5 per, I agree 🙂
In offering such a biased summary of a thorough and by-now well dissected literature, the Paleoclimate Chapter is something of a mystery. Is it representative of the rest of AR4?
One wonders why this was allowed to happen. I expected to read a thoughtful explanation of the hockey stick debate, perhaps pointing out the difficulty of resolving the issues, along with a general statement summarizing the NRC finding about the warming of the last 400 years. That would have done the trick nicely, and no one would have had much to argue with.
Instead, the report boldly misrepresents the literature.
Go figure! 😉
Wahl and Ammann (2008 ?) has still not even appeared online, even though dozens of articles accepted later have been printed – if you search Ammann at their online site .
Only one “in press” article is cited in chapter 6 – Wahl and Ammann. (As I discussed last year, it did not meet IPCC milestones for being accepted on time – something which amused me to point out as a reviewer. However, surprise, surprise, IPCC did not enforce its own policies in this case.)
#5,6. The misrepresentations are particularly cheeky given the existence of the NAS report and Wegman reports and all the publicity. As a reviewer, I suggested that, if these arguments are not material to decisions that policy makers are making (as realclimate says from time to time), then this section should be deleted in its entirety, especially since the document is already so long. They didn’t do so.
Not only the summary biased, but they have reviewer comments on file specifically identifying the bias. I’m surely qualified to comment on what we said. They mischaracterized our articles; I pointed this out, but they didn’t care.
BTW Cohn and Lins is cited on problems with confidence intervals – I think I noticed the cite in chapter 2, maybe 3.
Figure 3.40 is of ACE (Accumulated Cyclone Energy) for each of the six regions where hurricanes or typhoons occur. It’s as good a single measure of activity as we have. A casual, objective observer would look at those six charts and ask, “Where’s the global problem?”. The trends are flat to down, except in the Alantic (up, for reasons which have been greatly discussed on CA).
It would have been educational if the IPCC had shown the regional SST plots for each of the six basins. That would show that, despite rising SST, ACE remains trendless (except in the Atlantic). The SST are available in Webster et al, which is otherwise widely cited by the IPCC.
(It also would have been nice if they could have updated the ACE plots to include 2006 values.)
Wow…I’m reading the “Historical Overview of Climate Change Science” section and I’ve heard this before.
http://www.npr.org/templates/story/story.php?storyId=9082151
Some parts are verbatim.
This is from page 531:
Does the empirical evidence differ:http://www.sciencemag.org/cgi/content/abstract/308/5728/1611
David Smith:
The point is, that after Paul Linsay we can say that the trend in the Atlantic is spurious, like drawing a straight line through a selected part of a random walk.
If M&M are mentioned in the IPCC report, does that mean that Steve and Ross are part of the consensus of 2,500 scientists who support the IPCC conclusions ?
Ch 6:
Fair comparison, dodges the divergence problem 😉
Minimum uncertainties. I like that.
Reconstructions could be replaced with a straight line. Then the bias would depend on the past variability as well.
Steve, you appear to use the same light orange colour for a number of series in your charts – can you fix that?
Chart1: MBHPC1, Yamal, Mongolia
Chart2: Foxtail, Tirol
TAC asks;
“Is it the position of the IPCC authors that the central finding of the NRC report ‘€” the part that identified the flaws in MBH98 and MBH99 ‘€” could be ignored?”
The answer is demonstrably yes’.
I accepted an invitation from NOAA for me to be an Expert Peer Reviewer of the IPCC AR4 drafts. My review comments included:
“For accuracy and completeness, after “(IPCC, 2001a)” it is very, very important to add:
“However, since the TAR several studies have provided doubt to that work of Mann et al.. Many studies provide data that conflict with the findings of that work of Mann et al. (e.g. Beltrami et al) (ref. Beltrami et al “Long-term tracking of climate change by underground temperatures”, Geophysical Research Letters v.12 (2005) ). In 2005 McIntyre and McKitrick published two papers that together provide a complete refutation of that work of Mann et al. (ref. McIntyre S & McKitrick R, Energy & Environment, v 16, no.1 (2005)) (2005), Geophysical Research Letters Vol. 32, No. 3, (2005)). But, perhaps the most important of their studies of that work of Mann et al. was their publication in 2003 (ref. McIntyre S & McKitrick R, Energy & Environment, v 24, pp 751-771 (2003)) that showed it is not possible to replicate the work of Mann et al. There are several reasons for the inability to replicate this work of Mann et al.; not least that Mann refuses to reveal his source codes. The inability to replicate this work of Mann et al. means it has no scientific worth: i.e. this work of Mann et al. is anecdote of similar kind to a report of a ghost sighting. Hence, the IPCC now apologises for including it in the TAR. The IPCC will now disregard this work of Mann et al. and recommends that all others should also disregard it until it can be ‘€” and has been ‘€” independently replicated.”
This comment was either ignored or rejected by the authors of the published report. I have received no communication of any kind that explains why.
The IPCC claimed that the 4AR science report would be edited to conform with the SPM political report. Has anyone noticed any edits and is it possible to find out what was edited? If a list of censored facts and opinions could be compiled it would be highly embarassing to the IPCC.
If the IPCC was serious about being an open process they would release a complete report including the comments of reviewers.
#17. I haven’t seen the version that was available for SPM writing and so I don’t know what was specifically edited for conformity. My guess is that the differences will be in more nuanced statements in AR4 – which was the reason for the Independent Summary for Policy-makers – as opposed to huge changes in the report. However, not having the report itself available for release sumultaneous with the SPM is unconscionable and something that no non-climate science organization would ever do,
By keeping the report on ice for 3 months, the SPM got all the headlines; the report itself was let out on a week-end with no publicity. No one could compare the SPM to the Report at the time. It’s pretty cynical but it’s effective politically.
#8 SteveM, thanks. I found the citation to Cohn and Lins, the very last reference in the last appendix of Chapter 3:
This is pretty funny, at least in the sense that it may qualify as “not even wrong”.
To state the obvious: AFAIK, the only “simpler” model than the LTP model is a constant with white noise. I don’t recall the exact likelihood statistics, but the LTP model provides a better fit — by many orders of magnitude — than does the white-noise model. Perhaps the word “simpler,” as used in the IPCC report, has some post-modern, post-statistical, meaning? In any case, I don’t get it.
At a more fundamental level, “a better fit to the data” is not even the right criterion to be applying. The question is whether the model corresponds to the relevant physics: Is the stochastic process correctly identified and represented by the model? Everyone seems to agree that we don’t know much about stochastic processes related to climate, but this in no way argues for ignoring the complexity or employing a known-to-be-invalid, simpler, model. The AR4 itself notes that “internal variability is present on all time scales” (chap. 9, p. 667) [sounds a lot like LTP, doesn’t it?]. For this reason alone, and there are other arguments, one ought to employ tests that are valid in the presence of LTP.
In short, I’m disappointed. I don’t know what else to say. 😉
cont. 14
This signal dependent bias is something very important. Define residuals as r=p-T, where p is proxy-based reconstruction and T instrumental temperature, and observe that residuals are autocorrelated. One explanation can be autocorrelated noise, but I have something else in my mind:
What if the reconstruction does not respond to low-frequency variability? Extreme case is that reconstruction is independent of the temperature, and then E(rT)=-E(T^2). This implies that sample correlation between residuals and temperature is strongly negative. Tried with MBH99 AD1000 residuals, if one uses sparse temperature as a reference (which is a wrong thing to do), this correlation is -0.81. If one uses dense temperature, the correlation is -0.51. This is hard to explain with red proxy noise. It gives strong evidence that reconstruction cannot capture low-frequency variability. And it seems that AR4 (even though indirectly) agrees with this, but does not acknowledge that this fact alone makes those reconstructions completely useless.
( The code and data to reverse engineer MBH99 AD1000 step is here http://www.geocities.com/uc_edit/MBH99/residual_primer.txt .
cc. Michael Mann, Realclimate)
More to the point, we were both reviewers and , in our capacity of reviewers, objected strongly to a number of statements. However, are 2 of the 2500.
IF and when Wahl and Ammann is printed – and it’s now nearly 18 months since the Dec 2005 deadline for being “in press” – do you suppose that they will continue to include “Ammann and Wahl (under review)” as a citation for their rejected GRL submission. Since they rely on this submission for some key results e.g. RE benchmark, wouldn’t the inability to cite their rejected paper mean that they should substantially edit the paper?
In a normal science, this would be obvious. But Stephen Schneider is their editor and I’m sure that he’ll make it as easy as possible for a pro-Mann article to appear. But it’s odd that it’s still not in print. It will be amusing to see what finally comes out.
Sorry folks, the train has left the station. There are billions of dollars to be made in carbon offsets by many powerful corporations, individuals, and governments.
There could be 14 inches of snow in Miami and there would still be a “consensus” on global warming.
Re #21 Steve M
Is the list of reviewers made public ? Given your comments and those of Richard S Courtney in #16 above, it might be interesting to do a survey to see how many of them have been similarly ignored.
Re 20. If the residuals are autocorrelated that is surely prima facie evidence that the relationship estimated has left out important variables. This is the classic signature of a spurious regression.
#25. I agree entirely. But in Team-world, they don’t worry about possible mis-specification. They embrace it.
Mann says that he increases the confidence interval to allow for autocorrelated residuals, but Jean S, UC and I have been unable to decipher what he does and MAnn isn’t saying.
I knew that this bilge was likely to be in AR$ because it was in the Second Draft, but it is still amazing to see it.
This all becomes more confusing for the skeptic:
Viewing and contemplating the spaghetti graphs of temperature reconstructions makes one ponder the paper where Ross McKitrick discusses the meaning (lack) of an average global temperature. Were spatial variations in temperature that different in the MedWP compared to the ModWP? What would cause that condition? Or are we looking at poor replication of temperature measures from the various proxies? Can we simply ignore the divergent problem or should it be given prominence in the spaghetti graphs and really fuzzy up the picture?
On the other hand, those less skeptical souls with more confidence in the IPCC can look at the reassurance that the steady guiding hand of the consensus provides in offering explanations for these otherwise apparent contradictions ‘€” or at least with a reasonable degree of confidence ‘€” I think.
#27. the issues are different than average temperature. My view is that the medieval “proxies” are by and large a dog’s breakfast of noise. Mere;y calling them “proxies” doesn’t make them proxies. But if they were proxies then someone should be able to produce a climate model that produces the medieval dog’s breakfast. They haven’t and there’s no reason to believe that they can. Statistically the proxies behave like spurious regression as has been discussed here for a long time.
#27 “the IPCC can look at the reassurance that the steady guiding hand of the consensus provides”
If there really was a consensus, the expert comments of the 2,500 scientist reviewers would be on the internet for the world to see. I would like to see a high profile journalist ask the question, “Why can’t we see the scientific commentary? We are told there is a consensus so why the secrecy? Are state secrets being protected or is the consensus fabricated?”
I am reminded of the “dissenting opinion” of the U.S. Supreme court which acknowledges that not all of the justices agreed with the majority (consensus) ruling of the court. I’d like to see the IPCC include a “dissenting opinion” which acknowledges and displays the various opinions of reviewers which were not included in their report.
Shh, the hockey folks don’t want you to use that term “scientist” with M&M.
I had to explain this (and the IPCC process) to someone the other day who seemed to think all 2,500 scientists were in agreement on everything (as if that were possible).
re 20, 25
Here’s a really stupid newbie Q: If the proxies are calibrated to the temperature record, how can there be large or otherwise meaningful residuals?
Sorry, just trying to understand. TIA for any quick response.
People who dissent from the IPCC’s position exclude themselves from the scientific consensus and therefore should not be part of the IPCC process.
You should know better than that.
Are there rreally 2500 scientists, or are some of the 2500 “administrators?”
#33 John A says: “People who dissent from the IPCC’s position exclude themselves from the scientific consensus and therefore should not be part of the IPCC process.”
I believe the UN-IPCC is very similar to the Borg on Star Trek. The Borg mantra is “You will be assimilated, resistance is futile”. It appears that M&M have been assimilated since they are 2 of the 2,500 reviewers and now officially part of the consensus.
**I’d like to see the IPCC include a “dissenting opinion” which acknowledges and displays the various opinions of reviewers which were not included in their report.**
You cannot have a dissenting opinion – Then they could not say “The Science is in, the debacle is over”
Re: #28
I think that climate modeling could produce the required MedWP dog’s breakfast given sufficient time to figure out what reassuring results would be appropriate. The HS is probably too fresh in mind for the switch to have been made at this stage. Climate models have certainly had a go at the Holocene Optimum and in much the same manner as would be required to produce MedWP dog’s breakfast.
I try not to use Star Trek comparisons about the IPCC. Certainly a lot of its actions to my mind are anti-scientific and censorious which puts me in mind of the Russian Academy of Sciences during the time of Trofim Lysenko. (Actually the current Russian Academy of Sciences has made the same comparison)
The point of the IPCC is to emphasize one view as the only view of a wideranging, multidisciplnary consensus. Of course such a unanimity of viewpoint amongst scientists in any part of the sciences involving experimental evidence is a mirage.
I sense that scientists even in the “completely convinced” camp are starting to chafe at the political interference that, instead of sexing their work up, appears to be emasculating it.
The one thing I’ve noted about the language: it emphasizes certainty or near certainty over every single part of its case, as if petrified that someone will actually point a finger into it and find that its arguments are paperthin. Its worth watching all of the caveats to these statements of certainty are masterpieces of civil service doublespeak that Sir Humphrey Appleby would be proud of.
#23: That is in fact the anecdotal evidence that I have. By joining the AGW bandwagon, corporations get to kill two (or three) birds with one stone:
1. Be perceived to be good corporate citizens thereby improving their public perception
2. Create a new revenue stream in producing “gaia-friendly” products that a brainwashed public will rush out and buy.
(3. Create an additional barrier for competitors to enter the same market.)
It has very little to do with a conviction over AGW. It is all to do with raking in the green bills (excuse the pun).
Re 32
Because the reconstructed temperatures do not track the actual temperatures exactly – they are an estimate.
Re #39: Good point.
Of course when the polls (at least in Australia) are showing that 70% of the population accept the AGW position as expressed by IPCC, Algore, Hockey Team et al, it does focus the minds of both governments/oppositions and corporations.
An interesting example that I came across somewhere or another (maybe CA) a few days ago relates to the insurance industry. Apparently it used to cost $350 per year to insure a Florida condo, but now costs $10,000 (I could have that wrong but the principle is valid) due to AGW concerns. Now, lets say the insurance companies are as sceptical as most on this site. Are they going to come out and say so, and see premiums drop back to $350? Or are they gently going to nudge concerns along and maintain the very high premiums currently being asked.
Of course, in time ‘the market’ will address the issue with competing insurers coming in offering lower premiums. But in the meantime, I think that we will see record profits reported by the insurance companies.
how bizarre. Climatic Change is now up to July 2007, and 56 articles in press; and none of these is by wahl. I can’t find any articles on web of knowledge this year by him. That is certainly an unusually long lag-time for academic publishing.
Looking at the published articles in the June 2007 issue, there are acceptance dates of April-October 2006; all after the
on http://www.cgd.ucar.edu/ccr/ammann/millennium/refs/WahlAmmann_ClimChange2006.html.
Rather amusingly, if you go to
http://www.cgd.ucar.edu/ccr/ammann/millennium/publications.html
it now says that this paper is “in review”.
You don’t suppose that this paper got bounced during the review process, do you ?
per
#42 The editor of Climatic Change is Stephen Schneider. He’s not going to let down the side by bouncing Wahl and Ammann. He’s already turned a blind eye to some pretty outrageous behavior by Wahl and Ammann. I was one of the reviewers originally and asked for verification stations which they, like Mann, they originally withheld. (These were eventually included a year later after an academic misconduct complaint against Ammann.) They refused to provide verification statistics and cited their GRL submission as justification for their refusal. Unfortunately for them, I was one of only a couple of people who knew that their GRL submission had already been rejected. In business, if someone tried to pull a stunt like that, they’d be out the door so fast it would make their head spin. But it’s climate science and Schneider didn’t care about them trying to pull a stunt like that.
Re 41 trevor:
I think your almost 30 times insurance premium increase may be an urban legend. The Sun-Sentinel (Ft. Lauderdale) has one page dedicated to the “insurance crisis.” The highest reported rate increase request I saw was 76% and that was being rolled back. This is more typical.
Insurance is one of the most highly regulated industries known to man and management often finds itself trapped between public anger at high rates and statutory requirements to be financially conservative.
The last piece of clothing fell off the IPCC Emperor in Paris on Feb 2, 2007 when the IPCC released the Summary for Policy Makers (SPM) without releasing the scientific basis for the SPM. The IPCC refused to release the scientific basis (Working Group 1 report) for the SPM until months later. In the world of science, the scientific basis is published before, or at the same time as, any finding or summary. Instead, the IPCC refused to allow the public, the press, and scientists to check the scientific basis for the claims at a time such scrutiny would make a difference.
The IPCC’s release of the scientific information now, months after the press conferences and organized media blitzes, makes a mockery of science and science’s role in public policy. With the massive scope of the Fourth Assessment, including 2,500 scientists, and with the worldwide importance of the results, the IPCC had an obligation to disclose the scientific basis at the time the SPM was released. Instead, the IPCC designed and executed the greatest charade of science in history.
The evidence is clear. The IPCC’s Fourth Assessment is, first and foremost, a political propaganda vehicle. Regardless of whether the underlying science in the AR4 is sound or unsound, the IPCC Emperor is using the facade of science simply as cover for its political agenda.
That’s not entirely true. It’s only on the actual coast, and really only due to the massive losses insurance companies have taken in the last few years from hurricanes. I.e., AGW may be easy to blame, but it’s not the true culprit here.
Mark
#25 Maybe that is the reason why mike used sparse temperature record as a reference.. Residual std increases a bit, but 1-lag autocorrelation coeff. drops from 0.4 to 0.3. But no, it can’t be intentional, that would be scientific fraud.
This reminds me of
(Mann, Climate Over the Past Two Millennia, cites unpublished Robustness of proxy-based climate field reconstruction methods.)
This upper limit cannot hold for MBH99 network, as the output is just a linear combination of proxies. Output noise acc 0.4, input noise cannot be less than that.. Or did I compute something wrong here? 😉
RE: #49 – Plus, he or she who outwits a robber barron is a proper entrepreneur, whereas he or she who attempts to outwit a nanny state gets pounded down like the lone nail whose head does not lie flush with the board.
#50 What a tragic reality you have described. And #47, the insurance market in FL has been tremendously distorted. The primary insurer of properties for windstorm loss is Citizens. This is a state-established and funded insurer of last resort. Because of the risks involved, and the state’s refusal to let actual market forces and identified risk characteristics to be the critical factors in establishing premiums, the “citizens” of FL are essentially self-insured. When the “do-do” hits the fan, the people of FL will largely absorb and cover their own losses.
Of course, maybe this is really the way it should be. But please, don’t blame real insurance companies for heading for the hills.
Re: #51
Would you like to place a small wager on that? We should be so lucky. When (not if) Citizens goes belly up, do you really think they won’t demand to be (and get) bailed out by the rest of the US taxpayers?
“the IPCC Emperor is using the facade of science simply as cover for its political agenda.”
According to Monckton, the British government is footing the entire bill for the IPCC.
If so, no way could they come out with a report showing no warming, no crisis, that CO2 is insignificant compared to methane, etc.
The carbon trading markets would collapse (again) and the UK is specifically very invested in those.
A graph of global ACE (Accumulated Cyclone Energy) is available here and includes 2006. Double-click on the spreadsheet icon – ACE is given in chart #1.
ACE is the best single measure of global hurricane and typhoon activity. It is a function of storm numbers, intensities and duration.
As the chart shows, global ACE shows little change over the last twenty-five years, despite strong warming of the tropical oceans. (Data before the early 1980s suffers from measurement limitations, so little can be said about longer-term trends, if any.)
Re 54:
Maybe the oceans haven’t warmed after all and ACE is an indirect and better measure of the actual ocean temperatures.
still no sign of wahl and ammann. However, this is interesting. Note the date of acceptance.
per
#per, there are a couple of April 2007 acceptances that have now been published. What’s your theory on the Wahl-Ammann delay? This is getting noticeable.
Linking some of the follow-up on this matter, for any newer readers like me:
What a sordid tale of dubious behaviors…….
2 Trackbacks
[…] eindeutig ist diese Lesart der Ergebnisse paläoklimatologischer Forschung jedoch nur, wenn man – wie Stephen McIntyre beschreibt – einige redaktionelle Tricks anwendet. 0 Kommentare | VerlinkenKommentare zu diesem Eintrag:Diesen […]
[…] when the full report was released months after the SPM and without even a notification (see post at Climate Audit). Congrats to the IPCC for changing this. Hopefully IPCC will also quickly release all the expert […]