Anthony Watts has three new sites: Lovelock, Electra and Fallon, and there’s something unexpected in them (Aside from the jet fighter discharging on the weather station – which is disappointing but almost expected by now.)
These three sites were included in a priority list because they are among the 10 nearest neighbors of Reno airport and Reno airport was chosen as a type case to show that USHCN v2 homogenization (scheduled for rollout in July 2007) deals with urbanization issues. USHCN here purported to show that their algorithm netted out little difference between Reno and its 10 nearest neighbors, as shown below.

Figure 1. Difference between annual minimum temperatures at Reno, Nevada and the mean from 10 nearby stations. The red line indicates TOB adjusted data; the green line is based on the fully adjusted data. Units are °F.
The 10 nearest sites to Reno are: Tahoe City; Lake Spaulding; Fallon Experimental Station, Susanville, Colfax, Quincy, Electra PH, Lovelock, Yosemite Park Headquarters, Marysville. In modern climate science, apparently it is not necessary to either visit the sites or even to have pictures of them in order to draw these conclusions. Although “professional” climate scientists do not need to visit sites to ensure quality control, professionals in other fields have different standards of due diligence and Anthony has interrupted his latte drinking to place 3 of the above 10 sites on the photographic record, each with a different surprise.
Lovelock AP
There are two sites at Lovelock (note Anthony’s comment below): one at Lovelock AP and another in town. Lovelock AP is used in GISS and GHCN but not USHCN, while the town site is part of both USHCN and th other networks.
Anthony has posted up separately on the Lovelock AP observing:
“In addition to the air conditioners, there’s nothing like an occasional jet blast or propwash to complement your high temperature measurements. Thats not a museum piece, its a working jet. The aviation ramp is in fact just 10 feet from the Stevenson Screen. This station has since been replaced with a more modern ASOS, about 200 yards south of this location, but this Stevenson Screen measured data for years in the exact same spot. And yes, the data from it is in the GISTEMP database…. Oh, and they like light bulbs in the screen here too. Notice this screen is the old kind with doors that open side by side. At least somebody had the good sense to put in a timer.

The values for GISS raw, GISS adjusted and GHCN raw for Lovelock airport are identical. (There is no GHCN adjusted series). All three series are plotted in the figure below, but only the last one shows due to over-writing. BTW I’ve been wondering why the GHCN adjusted data set was about 30% smaller than the GHCN raw dataset – I guess that this is one example of a difference. I compared this to the GISS pot and the geometry is the same (although I’ve plotted it here in anomaly version). There is an observation gap between 1981 and 1989, but no adjustment. How would one go about ensuring that the later readings were not inadvertently 0.3 deg C biased relative to the earlier readings? It doesn’t seem possible to me. Given that there is no need to go out of one’s way to include compromised data, I don’t see why GISS or GHCN would use this station. It doesn’t even have a complete normal period from 1961-1990.

Lovelock Town
With his usual CSI diligence, Anthony located both the present Lovelock location in a CWO observer’s backyard shown below, together with the prior location at a post office shown in Anthony’s comment below. For more details see surfacestations.org. Anthony observes: “Its in a CWO’s backyard. I also have the Lovelock previous station location at the Lovelock Post Office. The CWO asked for it to be moved to backyard from the PO dues to vandalism.”

Here’s a collation of Lovelock airport and town information (keep in mind that identical versions overwrite). There is a strong divergence between Lovelock AP and Lovelock town in the 2000s, amounting to over 1 deg C. The Lovelock town station moved from the Post Office to the observer’s backyard. It doesn’t look like this has been picked up in the adjustment algorithms. What a mess this stuff is.

Electra PH
Here is a different sort of oddity. The station is at a power station, in a “rural” but hardly a rustic setting, as shown below. (For ful details, as always, surfacestations.org)
Again, this site does not show warming and measurements are not reported after 1994. The GISS homogenized version is shown below. (I think that Anthony mentioned that the caretaker said that measurements were discontinued in 1999?)
Now here is a plot collating USHCN, GHCN and GISS versions, showing values later than the 1994 GISS termination. It also shows high values in the early part of the 20th century truncated by GISS – doubtless for a “good” reason, but a reason that, to my unknowledge, is unreported.) I checked the monthly data and there are no values in 6 of the 7 series for Electra PH after Dec 1994. However the USHCN adjusted values (Filnet) continue to the most recent USHCN period in this data (Dec 2002). If Electra PH is in the roster of 10 nearest stations for the Reno comparison, it is there despite having no values for the last 13 years.
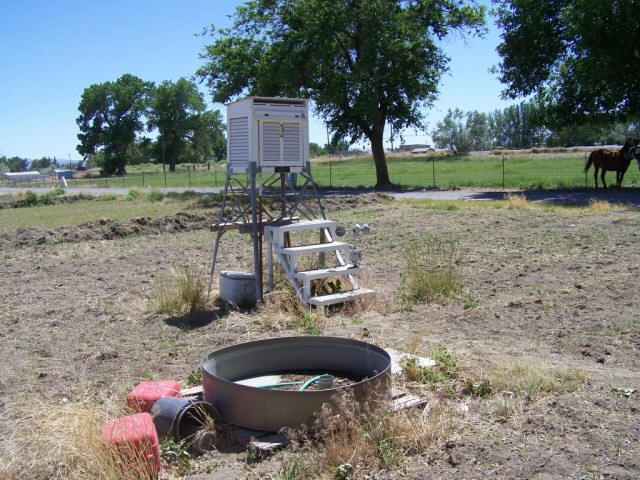
Fallon
Now for the most interesting one and it didn’t look interesting right away. Anthony reports that Fallon was hard to find: “At Fallon the actual site is ten miles from the USHCN recorded Lat/Long,and it took three hours of CSI work to find the station.” (I think that Anthony would have been good on The Amazing Race, where they had to find weird things all over the world.) Again see surfacestations.org for details. This picture “looks” fine at first glance, [but see comments in the thread about crop use].
Here is a plot of the various versions (the early part is truncated at GISS). Here we finally have a series that shows some recent warming (although it closes on an unexceptional value). USHCN data ends in Dec 2002 in the archived collation, but the GISS and GHCN data go to March 2006 (why not more updated, I don’t know). The surprising thing here is the situation is the opposite of what one expected: I, for one, was expecting to see exacerbated increases at the “bad” sites, but here’s what appears to be the opposite: a “good” site with strong warming commencing around 1993 – but stronger warming than the nearby “bad” sites.
Just to be thorough, I checked the Station History online here . Sure enough, there was a station move in November 1992, supposedly with a change in altitude of 1 foot and no change in lat-longs. At this point, I don’t know how much weight can be put on this sort of detail. Another move is reported in 1999 from 39°27’00″N 118°46’59″W to 39°27’25″N 118°46’51″W, southwest 0.3 miles. We’ve seen at De Bilt (and elsewhere) that seemingly innocuous moves of a few hundred meters can introduce measurement differences equal to total global warming in a century. In this case, no adjustment for the move has been made in any of the data sets. Should there be an adjustment? Because the bias is small relative to annual fluctuations, it’s hard to see how to find how to decide.
Begin Date |
End Date |
Latitude |
Longitude |
Elevation | Relocation | County |
Climate Division |
Time Zone |
|---|
The comparison to other sites indicates to me that the Fallon move has resulted in an upward bias to this series. My suspicion is that the USHCN adjustment methods (which remain opaque to me) are biased against picking up this sort of upward shift, but will pick up downward shifts like dogs on a bone. I think that the reason for this is the inclusion of series with known UHI in the comparanda, which then bias the results. If none of the series are going up (e.g. east Colorado) the net result may not be very problematic, but if there are some bad apples, I suspect that the properties of the method change. Increasingly, it seems to me that USHCN is doing something very Mannian. They throw all kinds of data into a hopper and hope that “advanced” methods can recover something from it, without using a method known to the outside statistical world whose properties were understood and without many people even understanding how the method worked. Subtle biases can creep into this sort of method.
Whether the shift at Fallon is enough to trigger some sort of statistical test, I don’t know. However, it was enough that it caused me to look for a change around 1993 and sure enough, there was a change in November 1992. So there’s probably some test that would pick up this visual perception. It’s not easy saying how you can adjust for these things when everything in the network has problems and you’re trying to separate out UHI bias as well. My hunch is that you need to focus on quality. The CRN network is fine as far as it goes, but it gives information from 2003 on (and CRN data is not available to third parties as far as I can tell.) It doesn’t solve the historical problem. My guess is that one needs to extract the “best” 300 or 200 or 100 stations and that won’d be easy, since it seems that small station moves at “good” sites can affect a record as thoroughly as incinerators at bad sites. By falsely claiming that USHCN stations were all “high quality” stations, Karl and Hansen have deflected attention away from the enterprise of determining what can actually be salvaged from this network. Clearly something can be salvaged from it, but the work should have been done long ago.


116 Comments
Roughly eyeballing the graph against the table it seems that the data jumped when the 1985 move occured and whatever caused the jump has been corrected. The field around the site appears to be plowed (ground cover change?)
Summary of Fallon NAS History:
1944 Commissioned
1945 Peak of training WWII
1946 Decommissioned
1953 Re-established
1972 Based upgraded to a major command
1987 Strike Fighter Squadron 127, the “Desert Bogeys” aggressors moved to N.A.S. Fallon
1995 TOPGUN moves to Fallon NAS
It’s interesting to plot these dates on the charts. The temperature pretty much follows the growth of the base and what might also correspond to the growth and population of Fallon.
I’ll pobably kick myself for asking an obvious question (I should probabaly kick myself anyway JFTHOI), but what is TOB.
TOB = Time of observation
In addition to #2 above:
1996 Carrier Airborne Early Warning Weapons School (Top Dome) moved to Fallon
1996 A Seabee construction unit and reserve adversary strike fighter squadron also relocated to Fallon
Fallons population increased by 22% in the 1990’s
For accuracy I’d like to point out that the picture above of the MIG jet next to the Stevenson Screen is the second temp measuring site at Lovelock, Derby Field (Lovelock FAA AP) not the primary USHCN site, which is a CWO north of town.
I’ve got the Lovelock Nevada USHCN station online
http://gallery.surfacestations.org/main.php?g2_itemId=2368
Its in a CWO’s backyard. I also have the Lovelock previous station location at the Lovelock Post Office. The CWO asked for it to be moved to backyard from the PO dues to vandalism. Here are the pix:
You can just make out the Stevenson Screen behind the tree. The SS was 12 feet from the building, and the MMTS is 14 feet from the building.
In my interview with the CWO, he said that the site was originally at the Lovelock Post Office, and he asked that it be moved to his backyard because of vandalism, and gave me the location at the rear of the PO where it was. Note the fan. Parking was up close too.
complete pix on surfacestations.org
Got it. I’ll edit the post accordingly. I see that the airport is only on the GHCN list.
Also FYI the Fallon USHCN is at an Ag Experiment Station. The field it is in is a working field, which is why the SS is about 1.5 feet higher than standard WMO observing height (note the steps). They rotate crops in this field, and of course the crops go through cycles.
The point is that its placed where changing albedo due to crop changes happen regualarly.
I am intrigued by the steps in front of the WS. I think in the Pielke paper much is made of the height of the siting of the WS from the ground. How material this is I do not know, but clearly with cool air sinking there is some likely difference in minimum temperature readings. In the realm of things, I would dismiss this kind of error but the reality is that we are talking about trends based on tenths of degrees per decade, which makes almost all sources of error which might not cancel out of potential significance.
WIth respect to the systematic documentation and calibration of a super set of sites, others may have already referenced this site, but when I visited the Karl’s CRN site I did not see these reports. I am not sure that we will see anything in 2007 based upon the current time line.
No flies on Anthony.
Re #3,
The B in TOB stands for bias, so the full translation of TOB
is: time of observation bias.
“This picture looks fine.”
Does it?
Remember Bunny Rabbet’s admonition that these pictures are only a snapshot (literally) in time. If that snapshot does not suggest a stable landuse/landcover in the immediate vicinity of the temp sensor, then ‘fine’ is premature absent examination of the changes. It appears from the photo that the landcover around this site changes frequently (bare soil is not a stable condition in this area), and that the landuse may as well (is that a livestock watering tank?).
Anthony indicates that this site is in crops. Crop history? Irrigation history? This is a university Experiment Station. Experiments involve fiddling with such variables to see how they effect crop yield or quality. How do these fiddlings affect field temps?
And how many moves has this station undergone? The station history seems to say 3 moves of 0.3 mi to the SW each. But the coordinates dont change for the first two apparent moves, the distance between the coordinates that do differ is 0.6 mi, not 0.3, and direction of the move was to the NE, not SW. And curator says the site location is unchanged for 100 years…
Re: #9
bernie,
I found this graphic that explains the station siting. Going higher does not seem to have a major impact, where lower would.
Whoops, try this link
#12. Jim, good point. From a measurement point of view, it would be interesting if a change of crop had as much impact on measured temperatures at a Stevenson screen as AGW.
Looks like a Mig 17. hot gas comes out the back.
Russ thanks. I was more interested in the impact on minimum temperatures and cold air sinking. In either case, the graph does suggest that there is some depressing effect on the maximum temperature. So we need to look at the net effect between maximum and minimum temps of increasing the height by about 50 cm or 1.5 feet.
I’ve added a new graphic comparing Lovelock AP to Lovelock town. These have separated in the 200s with Lovelock town warming over 1 deg C relative Lovelock AP. Is this due to less jet exhaust at Lovelock airport or more barbecues in Lovelock town? Inquiring minds want to know. The closer one looks, the worse this gets.
Steve:
How does one frame this as a general testable proposition regarding the use of current data to specify presumed warming trend? Clearly there are numerous sources of errors with these temperature records and the assertion that these errors cancel each other out is ludicrous given the relative precision of the predictions.
RE12 They also setup a RAWS station at the Fallon site, and it now appears to be the official station. See the image gallery:
http://gallery.surfacestations.org/main.php?g2_itemId=2366
Its also in crops, not the differences in land cover in the sat photo in the photo gallery vs the pictures I took Thursday.
http://gallery.surfacestations.org/main.php?g2_itemId=2426
FYI the reason I didn’t get close to the RAWS station and had to use telephoto was that the field of wheat or barley they were growing was so wet from irrigation it would have been a mudbath to walk to it.
I propose using USCRN criteria to evaluate EXISTINg sites.
Click to access X032FullDocumentD0.pdf
see page 31, from which I quote:
“There will be many sites that are less than ideal. Selecting a site is a series of compromises
between a number of factors. The CRN will use the classification scheme below to document
the “meteorological measurements representativity” at each site. This scheme, described by
Michel Leroy (1998), is being used by Meteo-France to classify their network of approximately
550 stations. The classification ranges from 1 to 5 for each measured parameter. The errors for
the different classes are estimated values.”
IT CONTINUES
“Classification for Temperature and Humidity
Class 1: Flat and horizontal ground surrounded by a clear surface with a slope below 1/3
(3 degrees.
Class 2: Same as Class 1 with the following differences. Surrounding Vegetation 5 degrees.
Class 3 (error 1 C): Same as Class 2, except no artificial heating sources within 10m.
Class 4 (error >/= 2 C): Artificial heating sources /= 5 C): Temperature sensor located next to/above an artificial heating
source, such a building, roof top, parking lot, or concrete surface.”
ANTHONY, you can actually go through your photos and classify sites as class 1 -5. Looks
to me like you found a bunch of CLASS 5s. Looks to me like they have an error estimate for
#20. Anthony, when did the RAWS station come into operation? Does it get mentioned as a station move, I wonder? Do you know which station is being used in the current records?
one more thing anthony.. toward the end of
Click to access X032FullDocumentD0.pdf
they actually have a scoring sheet for sites. Seems it would be valid to evaluate the current
system using the criteria for the future system. ESPECIALLy f they expect to construct a transfer function to
correlate the two systems
Their continued representation of Class 4-5 sites as “high-quality” has to be a breach of the Data Quality Act, if nothing else. It’s one thing to use the data that you have because it’s all that you’ve got. But Karl and Hansen had an obligation to not to call these stations “high-quality” without some form of due diligence that put them in a position to make these claims. Obviously they didn’t do any due diligence or they could hardly have called this ramshackle network “high-quality”.
#19. Bernie, I’ve been thinking about this. I think that you have to go back to the adjustment algorithm and think about whether it actually accomplishes what it claims to do. The algorithm seems to be an ad hoc recipe and poses interesting statistical issues.
USHCN think that they can find undocumented changepoints. So let’s say that you have a network of 20 stations, with some missing data, with differing degrees of a gradual UHI effect (or not), and differing degrees of microsite changes, and then random changes at unknown dates. The size of the bias from a change is small relative to natural fluctuations but large in comparison with the GW effect that you’re seeking to measure. I’m not sure that you can get there.
There’s an interesting article cited in Tamino’s excellent posting on Boreholes (which I’ll discuss some time) by Hartmann and someone, which discusses the difficulty of inverting borehole measurements once one adds a little noise to the network. I see an analogous problem here. If you’ve got one really good observing station that is really well documented, you can probably use that to disentangle other stations. But without some place to stand, I think that they’re going to have trouble. We’re already seeing that with their seeming failure to pick up changes at Lovelock and Fallon.
It’s another example of Wegman’s observation: you have guys trying to do something complicated, with good intentions, I’m sure, but the problem is pretty hard.
#12, #21
The station siting guidelines which Anthony links to on surfacestations.org say that the site should be surrounded by short grass or, where grass doesn’t grow, the natural earth.
Nothing about crops.
RE22 Curator at Fallon again about RAWS to be sure, but will have to wait until Monday. As I recall he said all data is sent to Boise now. Implying that the RAWS data is being submitted instead of USHCN Stevenson Screen. But I wnat to verify to be sure.
Given Steve Moshers discoveries in 21-23 of scoring criteria, what I think I’ll do is develop an ongoing Excel file score sheet for the entire USHCN network, based on SteveM’s original text file collation, then post that to surfacestations.org as an ongoing work. We’ll also use it to keep track of what sites are surveyed, pending, and still to be done.
Best to use the published scoring criteria. We can also develop a secondary scoring criteria that takes more things into account if we find the first is too simple to account for all that is being seen.
Perhaps we can start thinking in broader terms for such a criteria to include things that had not been thought of originally, but are being seen.
Anthony, when you save Excel files, may I suggest that you save in the tab-separated txt option. That way, the files can be read by R, but still open easily in Excel.
My read of the station location table above is that the Fallon Experiment station was relocated in February 1999, not November 1992. Each station location has a start and end date, and the “old” location shows operation from 1992 to 1999. There were also prior moves in 1992 that involved a drop in elevation from 3966 to 3965 feet and in 1985 that involved a drop in elevation from 3970 to 3966 feet.
Good job to all of you on this effort.
I searched for one of the Czech stations on the satellite map. The station is situated in an Institute of Potato Research in today’s Havlickuv Brod. The Institute is located quite obviously in the town, however, the GHCN database says “crops”… Interestingly, since 1935, when the station was set up, only two guys were taking the readings; the first one from 1935 to 1957, and the other is still at work since 1957.
Seems to me you scientific types are over thinking this problem, what with correcting for urban encroachment, light bulbs, and such.
These Thompson boxes will always be subject to incremental urban encroachment, so why not move them into the heart of the city, which is less likely to change in future years. This would introduce all stations to the heat sink effect, thus removing the need for subjective corrections of data. Introduce all the bad effects equally to all stations and the temperature trend over time will still exist. It will probably stand out more or dissappear altogether, but at least we will know it isn’t the fever dream of socialists bent on scaring the world red.
Might make it easier to be a temperature station monitor also.
#26
The CRN Program Site Acquisition Plan has this to say about tilled land at page 33
#29. I think that your reading is correct. I’ve edited accordingly.
#31. In terms of urban heat island effect, moving urban records to suburban airports, which in turn become urban centers, seems to combine the worst of both worlds. I think that the proper strategy is to try to find really good quality sites rather than trying to have 3000 sites with an unknown proportion with problems.
Maybe they should move all the sites to the middle of cemeteries.:) Most towns have one.
A perfect example of The ‘Bing Crosby effect’ – “Accentuate the positive Eliminate the negative” ?
-Courtesy of Steve Jones, the geneticist, UK Daily Telegraph June 8
#34
Perish the thought! Very unstandard place, the cemetery. 😉
We have cemeteries that are like woods, and other with no trees at all. Plus, European cemeteries have stone tombs, whereas American ones are often more meadow-like, with headstones only.
I have added on my website 11 stations with photos from the Oregon Weather Service.
Just one station, Corvalis may be considered fine but in the midle of cultivated lands so land use change influence may be important. Others range from bad to worse and all stations are used by the GISS (GISS chart is accessed by clicking on the top-left thermometer icon)
On quality stations, no recent temperature rise greater than past changes !
BTW, a disclaimer for my site : Google map is embedded on station reports so you can pan or zoom to “feel” the stations’ surrounding environment.
Drain, Oregon (a “rural” station)
Roseburg
RE 27.
Thanks Anthony. I think the best approach is to Hold them to their own standard. When I look at the sites
you have documented, I’d say a handfull qualify as class 1 or 2. The rest are 3-5.
The rhetorical point here is that this Criteria is THEIRS. So, I would humbly suggest
that we use their score sheets. Their classification system. Starting now.
keep a score sheet. We looked at 50 sites out of 400 ( or whatever the numbers are )
According to their scoring system. 30 sites were class 3 etc etc etc etc.
Otherwise, you find yourself answering idiot bunnies. Actually, I’m really happy
eli halpern rabbet pointed out USCRN. Give um enough rope.
Karl’ Criteria. Karl’s Scoring system. basically Karl is asking people to do what you are doing. so
your behavior can’t be questioned.
The larger issues, the statistical issues, revolve around how they wwill correlate the new system with the old system
I KNOW ONE THING.
They will fit the future system to match the past system, unless the past system is shown to be class 3-5.
if they dont fit the future system to match the past, we will see another divergence issue.
They believe the past system is quality. They believe it is a reference. So, they will adjust the future system
( via transfer fuction) to match the past.
It is critical, therefore, to classify the past system with the same criteria used to establish the future system.
Finding good sites is just as critical as finding odd ones.
RE37 Frédéric Those photos are from George Taylor, University of Orgegon State Climatologist. I have invited him to post them on surfacestations.org, he has not yet done so.
Since he has not posted on my surfacestations.org yet, I’m guessing he did not post them on yours. I may be wrong, as he may have done so for your site, but I don’t think it is proper to post them on your website without his permission or at the very least giving him credit for the surveys.
It is very very important as we go through this process to respect the work and rights of others, and to give credit for such work when it it used. Crediting and referencing the work of others is the hallmark of the scientifio community and we should act accordingly with digital photography files.
Re: 27
A map and list of the RAWS in Nevada can be found here. I cannot find the Fallon RAWS on this list. There are a number RAWS station around Fallon in the mountains. When I visited the Quincy site, the manual system had been replaced by a RAWS station in 1989. The Fallon RAWS could be a new placement, that does not show in the RAWS data base.
Steve, You noted:
You seem to be suggesting garbage in, garbage out. Or, perhaps more felicitously, noise in, noise out. The algorothms appear to be as much a source of noise rather than noise removing. Does this argue for compiling detailed station histories and going back to the raw data and start over from scratch? That will be a difficult political pill to swallow. Even to admit that you are doing it. Is this in part what Karl is now trying to do?
Another thing that has to be considered is snow cover which biases measurements ( i posted
a study on this the other day in Surfacestations thread.)
You’ll note if you plow through the CRN documents that snow cover/ station hieght above ground is an issue.
You’l also see stuff about sampling rates for sensors ( I posted stuff on this as well)
The sampling rate study was way above my statistical pay grade, but Professionals should have a look
Since the curent CRN spec calls for a 5 min sample rate.
Bottom line. Every time I read about the issues of measuring the noisy reponse of the climate over
the land, I keep harkening back to Pielke’s suggestion that we just look at heat
storage in the Ocean. Nice big analog filter.
Anyways, I’ll continue to look through the CRN Specs and see if anything pops out.
#41. It’s hard to say. Tactically, it’s probably not a bad strategy for Karl to do a “move on” strategy rather than trying to defend past articles. The CRN network is obviously completely irrelevant to the interpretation of 20th century temperature history. If anyone wants to calibrate proxies or things like that, you still need a 20th century temperature history and I think that the identification of high-quality series is what needs to be done, rather than a type of Mannianism.
#42. In principle that makes sense, but then you get the bucket problem and things like that. In terms of looking for information, I think that one should identify the parts of the ocean with the MINIMUM fluctuation either annually or inter-annually and focus on them.
Is the Fallon site in an irrigated field ?
Those ridges look a bit like what we ref to as “irrigation bays” in Australia.
Anthony: Just put this in the back of your mind
CRN sites
Click to access 71817.pdf
I’ll have to plow around some more, but if you look at the sites for Norcal You’ll
Not find anything that close to what we’ve been looking at. Sac Val is not sampled.
Anthony, the norcal sites appear to be over by eureka (humbolt) and north of Lassen, maybe redding, shasta
or burney area? ( lovely place have you seen the falls?)
Mid inland cali looks to be kinda by yosemite.
Coastal Mid cali looks like vandenberg? or Moro Bay? Hearst Castle? ( just kidding)
Anyways, I’ll see if I can finger out sites CRN is considering in Norcal, But it looks like
the Sac valley is not on the list.
RE45 yes it is irriagted, the field with the RAWS station had standing water in it, which is why I only have one side of the RAWS station in photography. The field was a mudbath that I dared not venture into.
It beats me why anybody would put a weather station for climate in the middle of crops. If you want to monitor crops reaction temp/hum, wind, evapotranspiration, etc thats the best place. Byt for climate its like adding a random number generator offset weighting to the data.
Maybe it was the deal that was struck way back when “we’ll take the weather station, but we get to use it for crop experiements” Way back when, many people in the science community were’nt thinking about climate with attention to detail.
RE 44.
Agreed SteveM. I was just speaking as an Engineer. If you needed to measure
Heat in the system, you’d instrument the ocean and not air flowing over the land.
IN the mean time I’ll dump more stuff to plow through. Initial studies comparing CRN system to the “HISTORICAL”
network. Anybody have a grad student to spare? The historic system (MMTS) has a bias ranging from
a few tenths to 1C.
I sense another divergence issue on the horizen.
http://ams.allenpress.com/perlserv/?request=get-abstract&doi=10.1175%2F1520-0426(2004)021%3C1590:ATCBTM%3E2.0.CO%3B2
Frédéric, you know that sewage tanks can put out an awlful lot of heat don’t you/ There was a sewage farm next to the Factory my father worked at, in the winter there was always a halo around the working tank-beds where the snow melted around the concrete.
Hi again anthony,
Not sure if you’ve seen this but the new CRN site in norcal is a Redding( wiskeytown) RAWS
http://www.ncdc.noaa.gov/crn/hourly. FWIW
I have enjoyed CA very much for many months now it is without a doubt the best science site dealing with AGW and other topics.
However I am just not getting enough out of it, can you please recomend or endorse a less technical site.
I still plan on checking out CA every day but need a less technical site to actually be able to understand more,thank you.
if mail is full jmlchawkfan@aol.com
I found that the following site has map coordinates that are more accurate than those in “stations.inventory”. These coordinates have six digits.
http://mi3.ncdc.noaa.gov/mi3qry/login.cfm
Just login as a visitor and you get a simple database program that will let you find a station from any one of several ID numbers and even by name. If you click on the station name when it appears (it’s a clearly marked link) you will then pull up everything you ever wanted to know about the site including it’s past locations. If you click on “Map” you get a Google map with the exact location marked on the map as well as the previous locations of that site.
I tried this for Everett, WA. The COOP number is 452675. It put the site in a patch of grass in a power company parking lot. I drove there and the station was within a few feet of where the map showed it to be.
I took a few pictures but didn’t do a complete site survey because I couldn’t identify the temperature instrument. What I saw wasn’t the MMTS (the one thatlooks like dishes stacked upside down on a pole) nor was it the Stevenson enclosure. All I saw was what appeared to be three rain gauges. One looked like the Fisher-Porter hourly rain gauge. The second looked like the standard rain gauge. The third was mounted so that the rain entry hole was six feet above the ground. It was wired to a display that was dark and had a cable going into the ground.
The site is listed as active and having an MMTS but I could find no temperature data for it after 2003.
Is there a third temperature indicator in use?
I could have missed it but these things look pretty hard to miss.
Going from Bob’s link I found a variety of sites in Southern NH, which is odd because one of the other locators all the sites were in the West. But Bob’s link gives some information that Steve, as a statistician, may find interesting.
From Bob’s link there are 10 sites in NH.
Of those 10 Sites
6 are on the latitude line 42.78333
2 are on latitude 42.76667
Whenever you have that many latitudes that close to the same, you’ll be hard pressed to find many different sites with the same longitude.
However, from a numbers theory perspective here are the longitudes that are at better than 2 decimal places.
-71.31667
-71.81667
-71.40833
-71.48333
-71.78333
-72.18306
I guess either there was a serious attempt to get a good distribution, else wise I’m going to go out and have a hard time finding them.
Was laying in bed not sleeping, thinking about heading out today, when I remembered out by the more western sites is a fun place near where I used to live called Parkers Maple Barn. http://www.parkersmaplebarn.com/ good place to get breakfast, particularly if you can get out there early enough, which I may be able to do, assuming I can find the sites on the way over. One is supposedly within a stones throw of my house.
I second Bob Meyer’s suggestion to look at http://mi3.ncdc.noaa.gov/mi3qry/login.cfm
Once you find the station you are interested in, click on the updates tab. Many interesting comments on local station moves, equipment changes and so forth.
RE 54, 52 I did some checking too, and it seems accurate enough based on stations I’ve already visited. Worst case error was about 100-150 feet. I’ll make this a permanent link in the resources section of surfacestations.org as well as putting it in the “how to” guide.
Thanks to Bob Meyer for ferreting out this link.
RE 50 Steve Mosher, When I do photos for Weaverville, I’ll pass right by there and get that one. I’m going to add a new category for CRN stations anyway so this will be a good first start.
I guess that I should have checked all of the links shown on this page. The link that I found is the same link that Steve McIntyre had in his blog article. The “Station History” link is the same as the one that I listed.
Just like me to re-invent the wheel. (I’ve done that several times before)
Warren Meyer has Gunnison, CO online now at:
http://gallery.surfacestations.org/main.php?g2_itemId=1731
Interesting site, more BBQ’s and convenient parking next to sensor. Gunnison has the distinction of being the coldest place in the USA on many occasions on any single day. But that obviously won’t hold true for summertime given this makeup of the site.
Also George Taylor has posted some of his photos up in the Oregon album. THANKS GEORGE. More 4’s and 5’s by my read on the USCRN scoring criteria.
RE57, Actually Bob, your link and method is a bit more streamlined than the original, and simpler is always better
For anyone in the Pacific Northwest (Washington, Oregon, Idaho, western Montana and parts of Canada) this link shows a map of some stations along with the ability to plot temperatures for these stations. This site is maintained by the Washington State Climatologist at the University of Washington. Maybe some other state universities/climatologists have similar sites.
http://www.climate.washington.edu/trendanalysis/
It helped me find several stations along Route 90 which lets me combine CSI with my vacation. BTW, I think we need “Climate Science Investigator” tee shirts.
Steve McIntyre – Do you have any listings of the sites you use for hunting down data. You had already found the site that I listed and since you’ve been doing this a lot longer than I have (or almost anyone else for that matter) your link list could probably save us a lot of time.
I think we need “Climate Science Investigator” tee shirts.
Darn fine idea, I’ll can get some made up and offer them on the website. I can do this easily.
Logo suggestions are in order. I’m thinking a Stevenson screen next to a BBQ grill with some guy wearing an apron that says “kiss the cook” or maybe “UHI Grillmaster”
RE 56.
You lucky dog. I don’t think many folks realize how wonderful that part of Cali is.
Several points for yu and others.
1. The CRN documentation actually provides a methodology for taking photots of a site, The number of photos,
the distance from the site, compass in the photo. etc etc etc etc. Have a look. I think that their
discipline and dilgence should be acknowledged. They Obviously recognize that there are issues with the current
system. Not that they have done anything about it, until now.
My thoughts on this. We should give credit were credit is due.
The rationale for collecting all this site data for CRN is clear: the historical network, designed
for another purpose, is Woefully inadequate for it’s current use. The question is, how does one
correlate the new CRN system, a system that cares about the height of vegetation around a station,
a system that has three sensors sampled at 5min intervals, a system that is located away from buildings,
plowed feilds, asphalt, concrete, etc etc. HOW, does one correlate this new CRN system with the historical
System? In my mind it is clear. You AUDIT the historical system with the same criteria that you used to build
new system.
2. Site selection California.
From what I can see they selected Whiskeytown, death valley, and a couple coastal sites. To me,
this looks like sampling at the 3sig locations of the california climate.
3. Adjustment methods. The histrical network employed a min max mean approach. max of the day is 100.
min of the day is 0. Mean is 50. The new system samples at 5 minutes. The new system has 3 independent
sensors.
4. Future of the historical system. I assume it will stay in place. Will homogeniety adjustements be made from
CRN to the historical system? WIll the past get revised some more?
Enough for now
Re:#60,61
Shirts are a great idea. Heck, I’d buy a cap, too, to shade my eyes when searching for those hidden stations. Maybe “Climate Station Auditor”? I like the UHI Grillmaster idea! Another board I post on had shirts/caps/stickers made at Cafepress.com. As I understand it, it’s the logo merchandise version of “book-on-demand” printing – no upfront costs, no inventory.
Re:#60
Bob,
Since you’re heading out I90, I’ll avoid that direction for now (I’m in Seattle). I was thinking of heading up I5 to get the Sedro Woolley, Bellingham, Clearbrook and Blaine stations in the next week or so, as long as it’s not too rainy.
BTW, thanks for the useful links.
PS – I’m still trying to track down how they are getting current (at least through 2005) temps from my local Seattle site, even though the station was shut down in 1998.
A brief report, following up on earlier discussion.
This morning I spoke with an acquaintance who works behind the scenes on the infrastructure of an airport. He easily answered my most basic questions, and (vehemently!) offered additional information. What follows is a timely “transcript” of our conversation, from hours-old memory:
Q: Do airports have just one climate sensor station, or multiple stations for different purposes (aircraft, etc?)
A: MANY stations. Our airport has one that the public sees (“Temp at the airport is ___”). Then there’s one for the tower, an entire array for the runways (see below), and a few others scattered around for other specific purposes.
Q: Why so many?
A: It’s obvious when you think about it. Our sensors are up to two miles apart — at that distance we often see a five to seven degree difference in the readings! How can you base decisions on information that’s so varied over a small distance?
(Gratuitous rant, no prompting from me): It’s just crazy that people think they can predict climate out 100 years! We can’t even accurately forecast a week ahead. Just look at the Super Bowl — they confidently predicted great weather the entire time leading up to the event, but it was almost called off due to the bad weather.)
Just think about temperature on the runways. It’s crucial for us to understand whether we’re in an icing condition or not. So we have ten sets of sensors along each runway. Just going from the start to the middle of the runway we can easily see a two degree variation. So parts of the runway can desperately need de-icing while other parts are fine. Lots of things affect this.
– Specific location (nearby terrain)
– Recent runway use: frequency and type of aircraft landing and taking off (exhaust, brakes/tires/etc on landing, etc)
– How clear the water drainage channels are (orthogonal grooves on the runway allow water to drain, but they fill up…)
– Amount of rubber on the runway (a LOT of rubber is left, filling the grooves, and changing the thermal characteristics. The runway is much hotter just before we clean off the rubber. We remove the rubber build-up twice a year.)
[end]
So there you have it. A fascinating account of airport heat and microsite impacts.
From this it becomes more clear that marginal stations with nearby building changes, pavement changes, growing greenery, etc etc can bring long term unknown bias to the measurements.
Regarding locations:
This search page (direct link): http://mi3.ncdc.noaa.gov/mi3qry/geoSearch.cfm , is reached when you click on the latitude of a result from the main station search. It’s a pretty handy geographic search tool: you can search for all stations in a lat/long box, or just a strip (unlimited lat or long range), or within a radius of a point or city. You can even apply an elevation filter!
The six-digit coordinates seem to be a mixed bag. For some sites, they are clearly just degrees+minutes converted to six decimal places. However for other sites, as Bob noted, they are clearly higher-res coords. Reading through some of the USHCN station history background info, I remember a comment to the effect that there was an effort relatively recently to remap stations to degrees + minutes+seconds+hundredths of seconds. Not all locations have been resurveyed, and of those that have been, they have found a number with “minute”/”second” values greater than 59, suggesting that the coordinates had mistakenly been measured in decimal coords. Hopefully, most/all of these have been corrected; of course, any decimal coords with the first and second pairs of digits less than 60 (presumably 36% of the mistaken coords) will not have been so identified.
Two sites from Illinois posted: Olney & Windsor
I will post more as time allows.
Expanding on the discussion of coordinates a bit, using Bob’s statement …
“I found that the following site has map coordinates that are more accurate than those in ‘stations.inventory’. These coordinates have six digits.”
… and Sidvicious’ observation that the reported lat or long coordinates for many stations in NH (there are 211, BTW) are the same to 5 decimal places (thus allegedly within ~ 3 ft of each other in that dimension) as a jumping off point.
You have not necessarily found coordinates that are more accurate. You have found coordinates that purport to be more accurate, in that they report more significant figures. Taint necessarily so.
My experience (spatial data manager) is that the average scientist, especially those working in the environmental fields, do not undertand significant figures and/or use them properly. This is especially true wrt geographic data. If the GPS unit spits out six decimals, they are going to write down six decimals. Then they will do one of three things:
1) Use six decimals for all reporting and analyses, or
2) arbitrarily use six decimals for analyses, and arbitratily truncate to X decimals (typically 2) for reporting.
3) truncate all coordinates to X decimals for all purposes.
The business of writing down the RMS or CEP error estimate of the GPS measurement, typically given in feet or meters, converting it to lat/long degrees (which conversion varies anisotropically and with latitude) and using the result to inform the number of significant figures reported … not so much.
Also, note that GPS is a new technology. Regarding the location of stations established prior: It is likely that some stations were surveyed using standard plane survey methods, which can give tenth of a foot accuracy. But its expensive, so often not done for these sort of data. I do not know if there was an SOP for weather station location survey (Armand indicates that there is one for USHCN now), but I doubt it mandated proffesional survey. And even a professional surveyor might have trouble coaxing his rod man out on to the roof or into the blast of the afterburner to get a good measurement 🙂
What was typically used (and still is by some Govt agencies) as an alternative to professional survey was the TRS (township, range, section) system. People would get out a map with the TRS on it, place a dot at the approximate location of their site, and report the TRS of the dot. The level of accuracy attempted varied, some reporting only down to section (mostly squares, ~1 mile on a side), some to quarter section, some to quarter quarter section (mostly squares, ~0.25 mile on a side). When GPS and Geographic Information System (GIS) databases came into wider use, those TRS locations were converted to lat/long. How?
Well, note that the dot on the map is long gone. All that remains is the record of the 1 mile to 0.25 mile square that the dot once sat in (insofar as the original observer thought it did). Conversion to lat/long involved assinging point coordinates to those ~ square areas, from one of the corners or the center. Where did those coordinates come from? Typically a GIS database of the TRS (aka public land survey system or PLSS). Will a GIS database of the PLSS report six decimals for a section corner? Often more. Is the PLSS necessarily surveyed to that accuracy? Nope. In vast areas of the West, it isnt tied to ground at all. What does the typical scientist do with those six plus decimal places of reported accuracy? See above.
The location for my local USHCN site is reported to 6 decimal places. This suggests +/- 0.3 foot accuracy. Its off by nearly 300 feet, assuming no datum conflicts between their survey and the one I’m using as a check … which is another potential issue to be aware of when you’re trying to find sites, or otherwise use location data. So, when you see additional decimals reported, bust out your salt shaker. Never know when you’re gonna need a grain or two.
RE67 Thanks Barry!
Well
8 Swings, 7 strikes and a foul ball. My average is not so great.
very rural sites were either not there, or on wildlife preserves no tresspassing.
The in town sites either couldn’t be found, or were on private property, I’ll try later on in the week. Fould ball was one fireman sent me to the fire department in another town. They had removed their Stephenson screen, and replaced it with some equipment on their mast. I don’t think they were a station of record, and if they were probably only went back 20 years or so.
8 hours, incluiding 1 hour wandering through the woods using my laptop as a Portable GPS. Stood right on the spot where it should be. Bupkis.
RE70 Sid, What sites? Maybe I can help you get a fix. The first thing I check is the GISTEMP record plot for the site at
http://data.giss.nasa.gov/gistemp/station_data/
to see if data is still being gathered. If it is not, its likely no station there, but its still important to document the site, even if the weather shelter is missing. For example, look at Lovelock Post office above.
RE 46 Steven,
I was reading http://ams.confex.com/ams/pdfpapers/71817.pdf as you suggested, and was shocked to see figure 2, where they have an aerial view on NYC. They used an aerial photo of Sept 11th, WTC fires. Jeez, when it comes to burying your nose in data and not paying attention to photography, this seems surreal. OF the thousands of aerial photos available for NYC, they pick this.
Anthony.
I found my problem (well some of them anyways). Some of the primary lat/Long are the old location (for instance the one near my house Hudson, NH), you have to dig deeper. I’m going to spend some more time tomorow, if I need I’ll ask then. I did document the sites I found.
You have not necessarily found coordinates that are more accurate. You have found coordinates that purport to be more accurate, in that they report more significant figures. Taint necessarily so.
I agree 100%, and alluded to in my original post. In other cases the accuracy isn’t near enough -71.5 is an error of what? a Mile. When your already a 1/2 mile into the woods, walking around in a spiral for a mile diameter isn’t what I’m looking to do.
I’m pretty sure I found the locations wher ethey were, now I need to update where they are currently supposed to be.
Anthony is it common for them to be in Private neighborhoods?
Oops, pushed the wrong button!
You have not necessarily found coordinates that are more accurate. You have found coordinates that purport to be more accurate, in that they report more significant figures. Taint necessarily so.
True. I should have been more precise in my formulation since it may appear that the second sentence about precision was the basis for the sentence about accuracy. These statements should be considered independently of each other. The first sentence about greater accuracy was based on the fact that the “station.inventory” coordinates placed the Everett station in the middle of the Snohomish River while the coordinates from the NOAA/NCDC site accurately placed the station in a parking lot. The NOAA coordinates for the Snoqualmie Falls site is a Puget Power station while the “station.inventory” coordinates were on the opposite side of the Snoqualmie river where no site existed.
Viewing several other sites using Google maps showed the NOAA coordinates were usually within the listed distance to the local post office and also in the correct direction from the post office while the “station.inventory” coordinates did not meet the distance or direction criteria.
If I were betting on which coordinate set would get me closer to the actual station, my money goes on NOAA.
RE75 “Anthony is it common for them to be in Private neighborhoods?”
Yes I’d say about 1/4 are private placements. For example the Lovelock NV USHCN site is at a residence. Here is the way I read it the placement preferences rank:
Most likely
===========
Federal government facility/agency (Airports, Post Offices, USDA, NOAA, National Parks)
State government facility/agency (Ag Cooperatives, State Parks, State Police, state forest fire agencies, state highway facility, Universities, Ag experiment farms)
Local government facility/agency (Sewage/water Treatment, city airports, police/fire depts, soil/water conservation districts)
Local organizations/businesses (fairgrounds, Ag business, farm coops)
local citizens/residences
============
Least likely
The MMS metadata system contains a field called “Managing Parties”, which will give you a name of an agency and/or a person. Thats how I located the Lovelock NV USHCN, otherwise I would search for days.
How to get the MMS “Managing Parties” data:
1. Open the NOAA MMS Station locator to get better latitude/longitude coordinates, press “Guest Login” button and then type station name in the search box.
2. Locate the station in the list, note detailed latitude and longitude info which you can put into Google Earth or similar mapping program to help locate the station.
3. Click on the Name of the station, it will pop up a new window. Note below the “Begin Date” there is a highlighted link with the actual dates, click the date to open details.
4. Look for “Managing Parties” in the MMS results (you may have to scroll down) and that will tell you the name of the observer, be it a private residence, government entity, or organization. Do additional Google searches as needed for the name, city, state and you may locate a telephone number.
I’ve updated the instructions on surfacestations.org also.
Sorry I meant private as in “No Trespasing” Private neighborhood.
RE78, haven’t seen any that are offlimits except at airports where security trumps public access.
Again best method to locate station is to get name of person/entity from MMS “mamaging parties” data, Google it, if you are lucky you get an address, tel#, call them if possible to let them know you are coming. Saves time and hassle all around.
Hey All:
I got some pics from the Yosemite HQ site. I will post it tomorrow. Am dog tired from hiking the Yosemite Falls. Spectacular and will post pics of those too.
PS. I didn’t get the pics of the MMS station by the HW 41 entrance. Passed it with the intent on getting the pics on the way down, but by the time we got to the local it was too dark. Sorry. Can go back again soon if it’s needed.
OK how’s this for T-shirts, caps, and coffee mugs? Comments welcome.
From my friend John Phillips:
And here is another version, slightly different:
Re: #14 & #20 Russ and Anthony Watts,
In the photos of the RAWS station at the Fallon site, it appears as if the crop is no more than 1 ft high. If so then this suggests that the climate sensors are no more than 1 yd/m above ground level which would not comply with the schematic shown in #14.
Were these sensors as low as they look?
barbecues: Anthropogenic Local Warming.
#81-83. Shouldnt the tag line be: “cooking” the data. Maybe you need a meat thermometer in the Stevenson box to tell whether it’s done.
Could show some accounting ledgers on that barbeque ….. LOL!
Air-Conditioners aren’t just for coolilng anymore
Re: 81 & 83
I like them, but would people unacquainted with the weather station auditing think that one of us is the chef?
Maybe it would be clearer if the cartoon had someone wearing a CSI jacket (sweater, earmuff, scarf, anything to keep warm with “CSI” on it) taking a picture of the chef.
Caption for the cartoon
“How do you want your data? Raw or cooked?” 👿
Does any one know if the temperature is measured at the Maua Loa site along with the CO2 measurements? I’ve tried a few Google searches without success. Can you point me to the data?
Thanks
Re #91
Dan Hughes,
Some data is available at ftp://ftp.cmdl.noaa.gov/met/hourlymet/
Re #91
Dan Hughes,
My bad! The MLO folder at the ftp site above if for Mauna Loa.
surfacestations.org CSI Don Healy uploaded a complete site survey for Everett, WA today but was puzzled as to why he could not find a thermometer, only rain gauges. Since he sent hi-res photos, I decided to do a look myself, and found that he had in fact captured the stacked plate temperature shelter.
See the inset photo
Here we have a perfect example of how upgrading from standard mercury thermometers in a Stevenson Screen to MMTS caused a site change. Due to the cable length, they had to move the MMTS across the street, next to a building, so the MMTS console could be inside the building.
Hey! How did Dr Evil get in my post?
It’s not that he isn’t appropriate, it’s just that I’m curious.
Thanks Earle, got it.
Re: 94
I was at that same site last week and I didn’t see the stacked plate (MMTS) sensor either. It appears to be at quite a distance from the rain gauges. It’s funny because a very curious cop asked me questions about what I was doing with a camera. I told him that I was photographing weather stations because some questions had arisen about their placement. He seemed satisfied with the answer. I wonder if Don Healy ran into any cops there because it seems to be a police parking lot (among other things).
I said before that the temperature sensors were hard to miss. I guess I was wrong. If I miss another one I may have to turn in my CSI tee shirt when I get it.
Well I finally got a hit on my 11th swing. Was actually in a very nice couples front yard in Milford NH. I actually got a hit at the Concord Airport, but you can’t see the sensor, it’s integrated (I assume) with a nav station. Based on the NH couple I think I know where one in East Derry NH is, I’ll have to call him, but about a 1/4 mile from the GPS location a guy had a n s**t antenna farm in his yard. I mean a sattelite dish bigger than his house, and standard directional type antenna also bigger than his house (looks like a large TV type), I’m betting this guy is into something, and has the temps stuff somewhere around.
Interesting how many are near places where I lived, the sattelite guy is less than a mile from a place I lived at on and off for many years. A mile away in this area is like maybe 10 houses in between.
It was nice to finally see one. They had both a Stephenson box and stacked plates, she reports it in every day.
Re: #81, 83,90
I like the first drawing better, but for the caption, it’s got to be Bob’s version all the way.
Perhaps drawing+caption on the back of the T shirt, then “Climate Science Investigator” on the front breast pocket area?
“Climate Science Investigator”
Are you hot, or is it just me?
“Climate Science Investigator”
Is that a thermometer in your pocket? Or are you just glad to see me.
Re 98:
SidViscous said:
“…about a 1/4 mile from the GPS location a guy had a n s**t antenna farm in his yard. I mean a sattelite dish bigger than his house, and standard directional type antenna also bigger than his house (looks like a large TV type), I’m betting this guy is into something, and has the temps stuff somewhere around.”
I guess the antenna farm guy was trying to contact the Intergalactic Panel on Climate Change. When you visit him be sure to wear a tinfoil hat. It will make him feel more comfortable when he talks to you.
What are you nuts, that guy was pumping out so much power do you know what that would do to a tinfoil hat.
I saw some tinfoil in a microwave oven once, I’m not going near him with ungrounded metal.
I got to figure out how to get some Faraday underwear to work. Maybe ground pads on both shoes.
I’m also betting he gets a better signal on his cellphone than I do.
I really should have taken a picture. I’ll make sure he’s next on the list. I know someone here doesn’t believe how big these antennas are.
Re #16
Typical “denialist” misrepresentation.
It is clearly a Mig 15. http://www.airnav.com/airport/KLOL/A
Why can’t you people just accept the “consensus”? So there may be a few small problems with the data (BBQ’s, AC units, asphalt parking lots, car radiators, jet fighter exhaust etc.)
What is important is that we address the moral issue. The facts are really irrelevant.
Fagot or Fresco?
The Mig 15 and mig 17 are easily confused. I wonder if Mr Dawson’s claim has been peer
reviewed? If you look at the vertical stabilizer, you’ll note a horizontal surface
2/3 of the way up. This means we can narrow it down to a mig 15 or 17. without
seeing the wing ( or a planform shot)and without a tail number, I assume this debate will rage.
Markings are Chinese? right?
I thought it was a 17 given Fallons aggressor training, I could be wrong. Not that
I’d admit it to you guys.
#83 – another caption suggestion: Adjusted Temperatures: Fake but Accurate.
Re # 106
Yeah, Mig 15 and 17 are very similar. Both use the same Klimov VK-1 engine so their effect on temperature readings would be the same. How do these guys have the cojones to use such compromised data and make such arrogantly confident projections?
P.S. I don’t think its PC to use the old NATO designation “Fagot” for the Mig 15. Perhaps a kinder gentler call name such as “Fabulous” could be substituted.
#38 steven mosher says:
The larger issues, the statistical issues, revolve around how they wwill correlate the new system with the old system.
I have an even simpler question. Let us try to correlate the old system with the old system
Where is the calibration record of each instrument?
RE109
“Where is the calibration record of each instrument?”
I asked that question of a CWO program manager at a WSFO. The answer: “there isn’t one”. Or at least one that he knew of.
I also asked if the MMTS units were periodically checked for accuracy. The answer: “only if somebody complains that they seem to be reading incorrectly”.
That would be a silly and incorrect thing to do in this Mann’s world. 😈
RE 108
I thought the Mig15 was non afterburning and the 17 was afterburning? Not that you light
it up next to the weather sensor.
Re # 113
The Mig 17″F” was equipped with the same engine fitted with an afterburner but I still don’t think it was supersonic. The Mig 17 superfluates the BBQ (note none visible at this site). Imagine how many weenies you could roast at full afterburner!
Re # 111
A fagot is also a British pork meat ball according to Wikipedia, but I trust Wikipedia only slightly more than RealClimate.
Lance,
I suspect you will enjoy this story. I was briefing this joker (http://www.af.mil/bios/bio.asp?bioID=5383)
and his horse holder whose last name was Abel: Fain and Abel.
Without getting into the details, at one point, Fain plops his rather small cowboy boots on the
table and fires this missile down my snot locker:
“son, are you trying to blow smoke up my ass”
…..
“Not as far as you know sir”
That was pretty damn funny, I thought. I do believe my boss shat himself.
Fain laughed. Abel scribbled notes.
Steve:
I love your position that governments should make decisions on the best available information…and I don’t disagree. However, it seems a bit odd to call the surface temperature data the best available information. I would have to give that distinction to the satelite and balooon data, even if the trail doesn’t go back as long.
It is scary that the quality of the temperature data in the US is so suspect, when it is probably the best in the world. If my estimate is right, the US constitutes about 6% of the world area. If they can’t get it right over the 6% with the best equipment, what can we make of the data from the rest?
I have never seen what the standard error is of the SST. How big is it and is all the observed change within the error of measurement?
By the way, I do agree that a government has to go with the best guess at a point in time if there is an incumbant reason to do so. At this point, it doesn’t look like there is much urgency…and then, I would suggest that it should reasonbaly wait until they have the quality of information necessary to make expensive decisions.
I’ve been taking the temperature of grass at coordinates 25.48 N lat and 100.19 W long, 18:00 UT. The grass has been warmer than air, except in rainy days. I think that the stations near or over ground with grass could give inaccurate measurements of T. For example, the temperature of air 1 m above the grass was 307.35 K, while the temperature of air above the soil was 308.27 K. In rainy days, the grass is generally colder than the air, thus it could affect the measurements of the air temperature 1 m above the surface of the grass.