Warren Meyers, who got the pictures of Tucson’s asphalt climate station, went to another USHCN station today. He writes in his blog:
“I then went to visit Wickenburg. Though it has been growing of late, Wickenburg would still be considered by most to be a small town. So perhaps the Wickenburg measurement is without bias?” Well, here is the site:
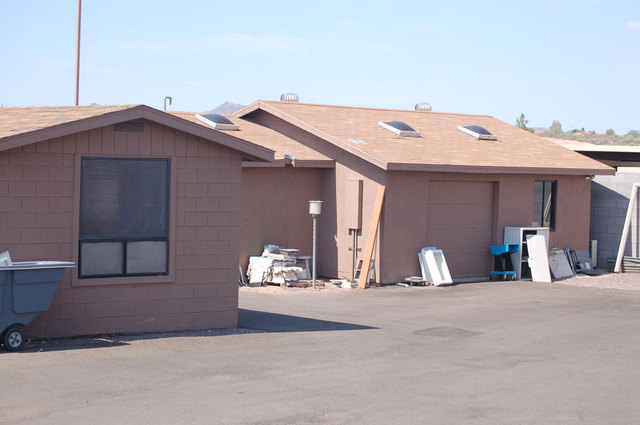
Ok not a great site, we’ve seen many sites now where the cable length limits on the MMTS have forced measurements to be taken near buildings and parking lots.
Oh but wait, there’s more.

Those five squirrel cage blowers are for the A/C heat exchanger for the adjacent building, by the way.


27 Comments
Well, by now we can all safely assume that stations with bias are not rare. I’ll refrain myself from claiming they are the norm, as there are probably also many stations which do not have this problem, but what comes into my mind is
1) The biased stations are not just exceptions
2) The biases introduced affect homogeneity (“jumps” in trends) or trends themselves or both
3) Standard statistical compensations (‘Just look at the data, without actual pictures of what is happening at the site’) may compensate for lack of homogeneity after some years of observation.
4) It is however questionable if those techniques will also filter the bias from trends. Especially if multiple stations in one gridfield are infected
Compensation should preferably happen on an individual basis. But if they would do this, most likely the stations wouldn’t be placed this way in the first place.
Add to this the suspicious corrections made on some of the data as Steve reported on before his vacation, and the question does pop up in what way we can trust the measurements.
My conclusions? I don’t know as the fog seems to get thicker and thicker. Should be not use this data and use satellite or some other source instead? Perhaps, but in many cases we may not have satellite data. Still a bias should be considered to be present.
I also feel that, except for compensations for stations movement or time of measurement corrections, it would be recommended to check any work using the station data by redoing the analysis with the uncompensated data but with a manual sanity reasoning whether something is rural or not. This to see in what way corrections – valid or not – affect the conclusions.
It’s is clear from this fine work, there are obvious documented failures of site selection and possibly in maintenance as well. Completely separate from the analysis above, I would be interested in a “TIME” vs “TOTAL Stations Photo-surveyed” history as this terrific grass-roots auditing effort gains strength.
One wonders if there are also potential ocean “anomalies” based on site selection? For instance, does placement near sea lanes (for better monitoring and maintenance) require adjustment? And because the stakes are so high and because of accessibility, are such stations subject to malicious or organized tampering?
There has also been this manic drive to resolve(?) the satellite record to more closely reflect the surface rise. Such thinking is now suspect, unless one actually wants the satellite data to match asphalt and A/C exhaust contributed temperatures?
Finally and unfortunately as this grows, one must also beware of fraudulent surveys, placed to discredit the fine work of the volunteers to date. Since there are clear failures in quality control, the next extremist tactic might be to phony a particularly aggregious site — then publically and with great (anti-AGW) fanfare tout it … only to later, (AGWarmers) expose it as fraud, to drag down the entire survey effort because of a deliberately planted phony recreation?
I’ll end my wax coniuratio…
Before you get to ‘individual compensation’, it would be useful to just ‘grade’ each site based on a static set of criteria. This one has close brick buildings, obscured wind paths, extensive pavement, _and_ close industrial AC. The only negative that comes to mind is shadows. One could even break the ‘rating’ down into severity of each recognized issue. On a 1-to-10, I think those buildings are about as bad as it can get. How about a 9.5. The AC is egregious, but it could be closer. An 8.
If the ‘raters’ can stick closely enough to an objective checklist, it wouldn’t take too many to get to a statistically interesting number of sites that have been rated. (And with the distributed environment nowadays, you could even set up for multiple independent evaluations of a site.) Which would mean that an actual scientific rewrite of the UHI paper would be possible. NOAA and a fair number of other people would scream, but a solid paper on this topic is indisputably new ground. So it will either get published, or at least raise awareness well out of the niches.
The Wickenburg temp history. Any guess when the site was moved?
http://data.giss.nasa.gov/cgi-bin/gistemp/gistemp_station.py?id=425722780090&data_set=1&num_neighbors=1
Amazing how they could ruin the value of a long-term historical site.
“…Amazing how they could ruin the value of a long-term historical site”
This is the thing that really surprises me. NWS has thousands and thousands of Coop sites, most of which have little significance beyond providing temps posted in the local paper. I can understand that they all aren’t first rate. What is shocking is that there seems to have been no attempt maintain the continuity of stations that were selected as part of the USHCN back in the late 1980s. Station histories reveal mutiple moves, equipment changes and changes in reported obstructions over the last 15-20 years. As far as I can discern, there does not seem to have been any effort to protect or preserve the integrity of the HCN stations.
Perhaps the NWS did not appreciate the significance of the stations being in the USHCN, I certainly didn’t until very recently. If that is the case they should come clean and admit it. Continuing to claim “the USHCN is comprised of 1221 high-quality stations” (http://www.ncdc.noaa.gov/oa/climate/research/ushcn/ushcn.html) is absurd and harms the credibility of the entire NOAA organization.
Here is a link to NOAA’s explanation of the “Science Behind the Calculations” of the national temperature trends:
http://www.ncdc.noaa.gov/oa/climate/research/ushcn/hcntmptrends.php#karl.and.williams.1987
Please note the paragraph which states:
“The observations come from the U.S. Historical Climatology Network (USHCN), a network of 1221 climate observing stations in the continental United States. These data are extensively quality controlled for errors and for small biases that may have occurred through time due to artificial changes at each observing station.”
Locating your temperature measurements next to asphault, AC units, buildings, etc. would, I think, give rise to those “errors and small biases”.
It is also great to know that:
“NOAA continues to work to improve the quality and representativeness of climate data provided to the public and scientific communities. In addition to advanced quality control procedures, these efforts include modernization of the USHCN by installing new, more accurate instrumentation, and ensuring proper station siting in the process.”
I suppose this is an example of “proper station siting”??
Frank K.
Further to the issue of random and sporadic changes, the Wickenburg temp shows no trend at all until a sudden change circa ’97-’99. GISS has a lack of sites across Canada and the ones that are current, such as Baker Lake:
http://data.giss.nasa.gov/cgi-bin/gistemp/gistemp_station.py?id=403719260005&data_set=1&num_neighbors=1
show the same discontinuity in the late ’90s. I suspect a change in instrumentation. This is crucial as the majority of the global “heat” anomalies lie above 60N and largely within the Arctic Ocean.
RE #4 and #7,
Those links are to temporary files at GISS and can be expected to break
within a few hours when the files get deleted.
#7 Roger: I have noticed soemthing very similar in the data of central and southern California stations. Between the years of 1976 through 1980 many CA stations exhibit an upward, single-year step in the temperature data that continues to the present. Good examples are Paso Robles, Ojai, SLO Poly, Santa Barbara, Fresno and Merced. Perhaps this is a true indication of a drastic climate shift, but if so, shouldn’t they all happen in the same year? I suspect some sort of regional network upgrade may have taken place during this period that resulted in a positive bias in the data. I have been scouring the station histories but have yet to find a common denominator.
It is calming to know that we are to some unknown degree of accuracy tracking the changes in microsite air temperature due to urbanization and population growth.
Click to access Goodge.pdf
interesting tidbits about Quality control in the NEW climate network
This article by John Christy gives one an idea of the problems.
Click to access i1520-0477-83-5-723.pdf
#4 – I notice that the data after homogeneity adjustment has the same values after the late 90’s and lower values prior to that, ie. the homogeneity adjustment enhances the late 90’s anomaly.
If the post late 90’s anomaly is indeed due to bias at this site, it would seem that the homogeneity adjustments are ineffective.
RE 13.
the homogeneity adjustments fall into three classes as far as I have seen.
1. Linear adjustments with two time periods. For example, Cooling a site from 1900 to 1920
and then warming it from 1920 to present.
2. Linaear adjustment from start to finish cooling the site or warming it.
3. Bizarre crap that adjusts like a random walk, but with a biased slope.
It might be amusing to calculate the anomaly map of GISS prior to Homog.
#14 In this case, the adjustment is basically a step function, 0 for 1990-2006, -0.1 for 1959-1990, -0.2 for 1958-1927 and -0.3 before that.
re 15.
yes.. its usually a step function… say .1C for 5 years, then .2C for 5 years then etc etc
Just run a linear fit on the step function.
I dont know why they Step it in to the data.. but you will see if you look at enough of these adjustments that they fall into the classes I described.
1. One linear adjust ( using the weird step function)
2. 2 linear adjusts ( TYPICALY one down, the other up) each using the funky step and fetch it function
3. nonsense random like walk stuff. I’ve only seen one of these.
NOW, it would be very cool to have a graph of HOMOG-RAW ( sometimes it has to be homog-Combo)
for every site. I’d like to look at them and see what I see. all 1221 sites. Just look.
See what you see. My sense is it would be a first step to reverse engineering HOMOG.
Could be a cool resource for Anthony if somebody created the script to just puke out the
Adjustment Charts. ( the GISS charts blow dead buffalo, [ snip if you must ])
#9 Jeff I have looked at most N Canadian sites, and probably sites north of 60 and it appears that there was a discontinuity in the mid-late ’90s. I suspect there was a change to automated sites at that time but have not had the time to research it in more detail. The GISS data was only recently updated to include monthly data to 2007. More complete data is available at:
http://www.cccma.ec.gc.ca/hccd/data/access_data.shtml
but you need to sign up (it’s free). I’m bothered by the fact that “the Arctic is warming 4 times faster than the southern climes” and yet there is no data in most of the area.
John Griffiths, who was involved with the historical network, would not have stood for this nonsense. Also, from one of his last messages to me, I recall there were much fewer than 1200+ stations, closer to 100 that had reliable records and rural location. With NCDC changing to a political, rather than a scientific focus, I wonder what happened to these stations.
In the interest of reducing confusion, I just want to bring my former commercial A/C experience to bear, like I did in comment #32, from the recent thread: “Pain in Maine, but they can measure rain.”
The A/C heat exchangers shown in the picture do not emit hot air like most condensing units that people are used to seeing. They emit relatively cool, wet air.
The ‘BAC’ you can see painted on the units stands for Baltimore Air Coil. BAC makes cooling towers; these are essentially evaporative coolers [or, swamp coolers, if you’re familiar with that term] that discharge outside. You can see two 5-gallon buckets of what appears to be algaecide in between the units, as well as a hose bib to service the units. The two big pipes coming through the side of the unit are the insulated inlet and outlet pipes filled with either refrigerant or a chilled water brine. The smaller black pipe is for makeup water. The installation could be for A/C, refrigeration, or chilled water for some or other industrial purpose.
These units always have water percolating through them, and the fans are designed to have as high as 100% duty cycle. They push ambient air straight up through condenser tubes and percolating water, then through a ~2″ thick baffle on top. Most of the air goes up, but some doesn’t. The baffles can get filled with moss and it’s not impossible that a unit can have baffle plates removed – they lift right off.
Cooling towers are the things that can become sources for Legionnaire’s Disease, if the water is untreated and they are too close to an outside air intake. It can feel noticably cool when you get within a few feet of one.
I’m definitely not saying that it’s OK to have these cooling towers in close proximity with a network station, I just saying that not everything that appears to be related to A/C is “blowing hot air” on the temperature probes, and people should understand what’s going on before predicting how mechanical equipment will affect temperature readings. I think Judith Curry would make a comment about ‘understanding the underlying physics’ if this were her area of expertise.
RE 19.
Thanks Jim! see what an army of davids knows!
RE19, Jim those are excellent points, it just goes to show why interdisciplinary view are important. What one person or even a group of people amy see, can be different than the trained eye of another.
RE: #19 – At a past employer, involved in semiconductor processing, we had a number of those BAC units. Loud suckers, they were. I seem to recall that the air run through the evaporators indeed exited cool. However, I recall that the air used to cool each BAC’s motors exited hot. Of course, we’re talking 20 years ago, so my memory may not be all there.
Here is the motor for a series 1500:
Click to access DUTYMOTORPRD.pdf
These definitely produce a bit of heat. Also, now that I recall a bit more, at least in the temperate air of the SoCal coastal region, where that employer was located, the exiting air of our towers was typically above outdoor ambient. However, in Wickenberg AZ during summer, that probably would not be too likely. You’d be above the safe operating area if exiting air was that warm …. I think??
#19, Steve Sadlov:
Yes, you’re right, that’s a very good point. [And a very good memory…] These are going to be belt-driven, too, so the motors aren’t directly in the airstream like they would be with many direct-drive fans. These motors definitely will emit a good amount of hot air, but from the position of the towers it appears that the motors are situated between the towers and the wall behind. What’s going to happen to that heat ? Will it rise up between the tower and the wall ? Will it be drawn by the relative low pressure on the side of the unit created by the fans and enter the cooling tower ? Or will it snake past the low pressure zone and enter the network station ? I wouldn’t care to guess, but the third option seems least likely to me, as the wind entering these units is fairly strong.
#23, Steve Sadlov:
First, my #24 was directed to your #22, not my own 19 – but I’m sure you’re smart enough to have figured that out.
Second, you said:
You could be right on both counts, it will all be dependent upon the heat load that is being moved. The thing about these units is that they’re designed to remove A LOT of heat. They will be oversized, the question is how much will they be oversized ?
It’s essentially a big swamp cooler that pulls in hot dry air and emits cool wet air. As you allude, they will be especially effective in places like Arizona. The process heat load is on top of that. So the cooling tower will give you a constant 150-tons of effective cooling, and that cooling will be divided between whatever variable heat load you produce as you turn your various processes off and on, and cooling of ambient air. You don’t typically buy a 106.5 ton cooling tower to match your process, so there’s usually quite a bit extra cooling capability in the tower to cool ambient air. If you’re working in wafer fab or magnetic disk production, however, where new processes are being constantly being added / upgraded or you have to move more 72 degree air through the HEPA systems b/c your clean room had to be upgraded from class 1000 to class 10, then you could easily start to approach the maximum cooling load available from the tower. You could then expect to be emitting relatively warm wet air until the cooling tower got replaced with a larger one.
More of the newer installations attempt to save operating costs by using variable frequency drives on the fan motors. The air flow gets throttled back, but not the water flow. This will reduce the cooling capacity and increase exhaust temp – so that’s another important factor, but I wouldn’t care to guess on it unless Mr. Watts’ volunteers start looking for slow-spinning fans and/or installed VFDs near the fan motors.
You’ll note that in the above photo there are two cooling towers. That implies that they actually maxed out on [or came close to it, or planned to come close to it with a plant expansion] the one to the left at some time in the past and replaced it with the one on the right. They could also have parallel or staged systems.
Lots of Qs, but insufficient data to come to a conclusion. Maybe the easiest thing to do is just measure exhaust temp and ambient temp for all HVAC equipment.
Re: #19
I think this episode brings into focus the comments that Steve M has made about the observations from these sites to date and that is that while we cannot estimate any quantitative correction (or even direction of the correction) from these findings, it does certainly point to a lack of quality control on the part of the scientists responsible for and using these measurements. It also places some uncomfortable amount of uncertainty around the accepted measurements and elicits some interesting comments from those with a stake in the published error margins.
While my comment may be considered stroking Steve M, I could say the same about Jim Edwards stroking Judith Curry; however, when it comes to quality control, I’ll take Steve M every day of the week.
Temperature does not equal heat. Cool, moist air may contain more heat than warmer, drier air. This is a very common red herring.
An air conditioner is a machine that moves heat from one location to another and produces an additional amount of heat depend on its (in)efficiency.