Ever wonder how to adjust in Russia – or what sot of gestures Russian adjusters make when they’re jesting and not jetsetting? Here are Hansen’s urban adjustments for 4 different Russian “urban” sites.
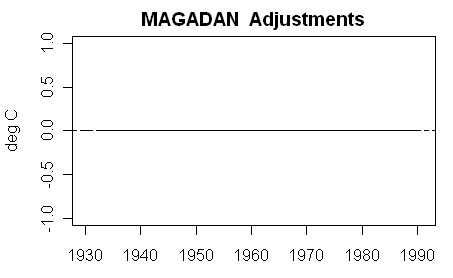
In the graphics shown, an upward adjustment in the past is an upward re-statement to increase past temperatures to compare with present temperatures and is more or less what one expects. So why do Ivesk and St Petersburg have opposite patterns? Why does Hansen think that the UHI in St Petersburg has declined in the past 15 years? Why does Hansen adjust for UHI at Cita, Siberia back to 1980 and then cancel out the adjustment going back to the 1930s? Why is there no adjustment at Magadan?
The skill-testing question: provide a rational physical theory from which one can derive these urban adjustments.


40 Comments
Just for reference. Bagdarin would show just 3 steps not an entire flight of stairs as indicated above?
In IE the 2 graphs on the right are hidden behind recent comments
Hmmmm. This is becomming farcical. Has there been any official response to all this over the last couple of days (and by official, I don’t mean realclimate)?
The little boy cried out: “But he’s got no clothes on!”
Well, if H. C. Andersen had lived today, the fairy tale
would probably have ended with the little boy chopped
to bits by the imperial guard. The climate talibans rule.
[snip – offtopic]
Re: 2
click the graphic
[snip – sorry: you’re venting here and I’m trying cut down on the venting quotient here. It’s offtopic as well].
But to get back to some neutral ground where the opposing sides begin to trade scientific findings in a scientific, neutral, and civil way well, that will be some major undertaking!
The first rule of research:
The easiest person to fool is yourself.
Not having access or knowledge of the justifications is frustrating–how can anyone ‘peer review’ this work when it is presented as a black-box?
It seems to me that if Hansen is taking tax payer dollars for his research, and Hansen is or others are using his research to push for public policy change, then the tax payer should have a right to examine his code. If peer pressure doesn’t work, and an FOI request doesn’t work, then it looks like the only thing left is a lawsuit?
St. Petersburg is near water, farther north, and was built on swamp.
Going by these adjustments and the ones in India and others we have seen, it is apparent that the theory used to make the adjustments is not “robust” (to use the Team’s terminology) in reference to the actual data which is available.
In this case, I am giving Hansen the benefit of the doubt. I am saying the theory behind the adjustments is not robust enough given the poor overall quality of the data. A less generous person would have to conclude that the adjustments are either random or purposely designed to show an AGW case.
North Atlantic Oscillation?
If the adjustments determined by minimizing the differences to eaby stations than we should look to trends in nearby rural stations to explain the corrections. Maybe some trends can be explained by the end of operation of some stations. For example, the CITA adjustment after 1990 could be explained by the fall of the Soviet Union and the closing of some stations.
Magadan adjustment could be explained by the lack of nearby rural stations.
St. Petersburg could be explained by the progressive inclusion of nearby colder station between 1940 and 1980.
I found Waldo. He’s at NASA, under Hanson’s desk!
The method of calculating adjustments is not based on a physical theory. It is based on (relatively) nearby rural sites.
Out of curiousity, are there other urban sites that show the “expected” pattern? And is it correct to be looking only for negative trends while accusing Hansen of looking only for positive trends?
The reversal in the adjustments to Saint Petersburg and Cita both do seem to occur right at the fall of the Soviet Union. This might be coincidence or it could be related to closing of stations as noted above. The only other thing I can think of is if some economic metric was being used to calculate a UHI correction. The Russian economy went into free-fall around this period and GDP, electricity usage and other indicators all fell dramatically. Hansen mentions nothing like this so probably not, but who knows anymore.
The inverted adjustment trends between St P’burg and Cita are also interesting. It reminds me of how the raw data trends for Orland, CA and Marysville, CA were flat and steep sloped, respectively. The homogenized data had both with a shallow slope. That seems to indicate that good sites homogenized bad sites and bad sites homeginized good sites. The error was spread around instead of removed. I know St P’burg and Cita aren’t related, but maybe something similar is going on with their adjacent sites.
It seems that the corrections are obtained with a function composed of two straight lines. They minimize the differences to the nearby stations by optimizing:
– the slope of each line
– the year common to the two straight lines
See:
http://www.swordscrossed.org/node/1415#comment-61444
Since they also optimize the year common to the two straight lines, trends of different stations can reverse at different years.
When nearby stations are used to make corrections, one should expect random corrections. Some stations will be corrected in the wrong direction just because nearby stations must have data that changes randomly. So, we could understant this a little better if we could:
– plot the distribuition of the corrections in a graphic
– see what happens when rural stations are corrected based on other nearby rural stations. The correction of rural stations based on nearby rural station would give the magnitude of the random corrections.
Whatever the method for the corrections the question posed by Steve is pertinent and as far as I know still open: rational physical theory from which one can derive these urban adjustments. I have no idea.
best
Steve
This is basically a JORC issue, in terms of scope.
There are raw data supporting this ?
here’s the latest from the Met Office
#18, Hansen says explicitly that they make the adjustment by hinging two straight line fits. That’s not the mystery. The issue is – after you look at the adjustments, can one discern a rational physical pattern or purpose to how Hansen did it.
««Thats not the mystery. The issue is – after you look at the adjustments, can one discern a rational physical pattern or purpose to how Hansen did it.»»
Steve McIntyre,
If Hansen uses the nearby stations you should not expect a rational physical pattern. At least not for particular stations. You should expect to find some station with irrational corrections. Nearby stations may have random trends disconnected from the physical reality. A statistical analysis is necessary the verify if the fraction of irrational corrections is acceptable.
It seems that correction of urban sites with data from nearby stations eliminates the information about the long trends of the urban sites.
re 22
Does anyone remember the concept of “grue”. This is a philosophical concept designed to test the limits of inductive reasoning. It has been defined in a couple of ways but the one that I am familiar with is that guue is a colour. Objects that are grue will be indistinguishable from green if view before a certain date and will be indistinguishable from blue afterwards. The philosophical problem is how one can tell grue from blue and green by inductive reasoning.
Now it from the UK Met office report in [22]. AGW can be considered homologous with grue.
A quick Google suggests that the Izhevsk monitoring station should be labelled rural rather than urban. It’s at the airport, which is about 5 miles from the edge of the city surrounded by farmland and forest.
Here’s a photo of the countryside around Izhevsk with the city in the background. The pic is actually labelled “The city is within 10 km (6 miles) of the airport”, so it might even be a view from the airport towards the city. Anyway – it’s clear that Izhevsk is one of those places that go from urban to rural very abruptly, and the meteo station is miles beyond that abruptness in the middle of lots of rurality.
Not what you’re discussing in this thread but I thought it might be of interest.
Sorry – wrong link in that last one. The meteo station location is shown here.
Vinny Burgoo# You do have a point however as reqular readers of this Blog will know asphalt and concrete have different heat propties to earth; also theirs the problem that site this may have been altered; i’m think of extentions and new runways. In addition the trees clearence will change the heat patten again. all make this site less reliable. So a urban classification is most likly the best.
However if its structorly that same then a interesting tread may be seen.
I wonder, if Czech Milesovka (station 11464) is also adjusted. It’s on a mountain top, but not in mountains. The data on Sinan’s visualization look rather straight – no big temperature jumps.
24: great point. But Steve is passive aggressive when proven wrong. And he is only intereeted in insights when they help his point of view or his personalized batters. Nort for them in and of themselves. That’s why you need to watch him. Use what good comes out of him, but realize that he is skewed in presentation.
Steve: if you want to make a substantive technical point, fine. But don’t complain about snark and then make ad hom comments like this.
For those wondering what the heck the German guy said, it’s something like this:
“Strange temperature adaptations
Anyone who believes that the temperature data of weather stations are used 1:1 for the climate reconstruction will rub their eyes in surprise if they find out how many different adjustments are carried out in these temperature data first.”
I have some questions that #30, the German fellow alluded to, when these adjustments are made are they one to one (1:1), i.e. the same ratio (linear) or amount? Example if a temperature station in the middle of a field goes up by one degree for the month, does the person calculating the bias do so to the same value of one degree to the nearby urban station? It would seem to me that just as different surfaces absorb heat at different amounts that also would absorb heat differently in a non linear fashion. Is the absorbtion of heat from the sun linear for grass? Is it linear for asphault or concrete? In engineering we learned that the greater the temperature difference, the greater the RATE of heat transfer that occurs, i.e. it is non-linear. The heat that is transferred at one degree is not in the same proportion as at two degrees, hence the air over black asphault will heat more rapidly than over grass in an exponential amount differently based on the ambient air temperature. So you have four issues: 1. the “amount of heat absorbed” by the different surfaces, 2. the “ambient” air temperature for the starting point, 3. the “amount” of heat radiated to heat the air for the given surface, 4. the “rate” of heat transfer to the air for the given surface.
Example for the sake of argument let’s say that at 60F, the asphault surface heats the air above it 5F, but the grass field only heats the air 1F, as the day goes on, the ambient rises to 70F, the asphault heats the air above say 20F, but the grass field only heats the air 2F. There is a non linear relationship of heating at each degree ambient. Not being familiar with the heat transfer rates of asphault and grass, I am just throwing out a number for example, maybe Steve M. or someone knowledgable can speak to this?
Steve: I wash my hands of you.
Promise?
I struggle with all this because of my education level, but what I get out of this is that the quality of original data is so poor that it presents a challenge. The data is adjusted in the way that seems best to some experts and questions are asked about their methods.
Then people get mad and wash their hands and stomp their feet – weird
JM said:
“If Hansen uses the nearby stations you should not expect a rational physical pattern. At least not for particular stations. You should expect to find some station with irrational corrections. Nearby stations may have random trends disconnected from the physical reality. A statistical analysis is necessary the verify if the fraction of irrational corrections is acceptable.”
that’s fine. no problem. why not make source code available, so everyone can see how you arrived at irrational corrections?
but really, there exist standard statistical methods for resolving differences like this, why aren’t these standard methods used?
RE: #34 – I am probably the first, and probably will not be the last, to suggest that you, TCO, really ought to consider professional help.
argh …. probably NOT the first …. need …. more ….. coffee ….
38: You are not the first.
I’ve found good descriptions for everyone here http://www.ncga.com/public_policy/PDF/03_28_05ArgonneNatlLabEthanolStudy.pdf
You’re either:
“…in the pockets of the capitalist-industrialist-polluters.”
or you are
“…influenced by groupthink-careerism-environmentalist-ideologues”
One Trackback
Kuriose Temperaturanpassungen…
Wer glaubt, Temperaturdaten von Wetterstationen werden 1:1 für die Klimarekonstruktion eingesetzt, wird sich verwundert die Augen reiben, wenn er fest stellen muss, wie viele verschiedene Anpassungen an diesen Temperaturdaten vorgenommen werden, bevor….