Here’s something I meant to post up when AR4 came out. I was reminded of this when Rob Wilson posted recently:
Lastly, lets not forget that TR based reconstructions of NH temperatures exist that do not use Bristlecone pine or Foxtail data.
Rob’s point here is very disingenuous (to use Mann-speak) since millennial reconstructions are addicted to bristlecones and foxtails. Reconstructions using them include not just MBH98-99 (which is not robust to the presence/absence as admitted by even Wahl and Ammann); but also Crowley and Lowery 2000 (two bristlecone series, including Almagre); Esper et al 2002 (two foxtail series); Mann and Jones 2003 (Mann’s PC1); Rutherford et al 2005 (Mann’s PC series flagrantly unamended); Moberg et al 2005 (3 bristlecone series); Hegerl et al (Mann’s PC1 and the Esper foxtail average); Osborn and Briffa 2006 (Mann’s PC1 and the Esper foxtail average); Juckes 2007 (the two Esper foxtail series in his Union reconstruction). In each of the studies where Mann’s incorrect PC methodology is not used, there are only a small number of series used (6-18 in the medieval portion). Can a couple of strongly HS series mixed with white or low-order red noise in a CVM procedure yield a HS recon? Readers of this blog know the answer to this, although “professional” climate scientists seem mostly unfamiliar with the statistical issues.
There are only 3 reconstructions in which foxtails and/or bristlecones do not play a role: Jones et al 1998; Briffa 2000; Briffa et al 2001; and D’Arrigo et al 2006. Without the bristlecones, Briffa et al 2001 has a pronounced Divergence Problem and the Team has taken to truncating the record in 1960 (or even in 1940 in Juckes et al). As noted elsewhere, Briffa 2000 and D’Arrigo 2006 have virtually identical medieval rosters and cannot be said to be even somewhat independent in their medieval-modern comparison: in each case, the medieval-modern relationship is changed merely by using the Polar Urals Update (instead of Briffa’s tricky Yamal substitution). In this case, the proxy was updated; the Team didn’t like the answer and so the update was never published as a separate study; they changed the proxy instead. Splicing is the main issue in Jones et al 1998.
Anyway on to the proxies shown in AR4. Here is their Box 6.4 Figure 1. I think that I’ve discussed their proxy spaghetti graph before. It shows 8 series specified only with a rather vague caption – for example, does “W USA” adequately enable a reader to locate a proxy, even if he knows that it was used in one of Mann and Jones (2003), Esper et al. (2002) and Luckman and Wilson (2005)?
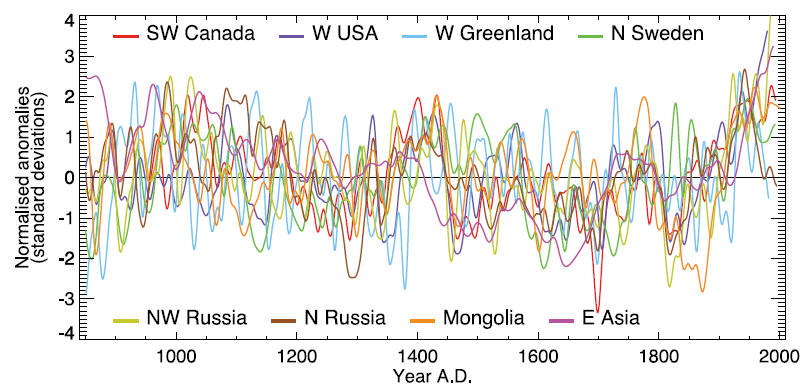
Box 6.4, Figure 1. The heterogeneous nature of climate during the Medieval Warm Period is illustrated by the wide spread of values exhibited by the individual records that have been used to reconstruct NH mean temperature. These consist of individual, or small regional averages of, proxy records collated from those used by Mann and Jones (2003), Esper et al. (2002) and Luckman and Wilson (2005), but exclude shorter series or those with no evidence of sensitivity to local temperature. These records have not been calibrated here, but each has been smoothed with a 20-year filter and scaled to have zero mean and unit standard deviation over the period 1001 to 1980.
Because I know my way around the proxies, I can decode these clues. First, I knew from a previous iteration of the diagram that it’s drawn from the data versions used in Osborn and Briffa 2006 (Briffa is the IPCC lead author here). Here’s my replication of the above figure, which is pretty accurate up to nuances of color palette. In this case, I’ve taken the smoothed version of archived data from Briffa and Osborn 2006 (the smooth said to be a 20-year smooth) and then smoothed it one more time with another 20-year smooth. With only one generation of 20-year smooth, I don’t get as close a match; so it looks like IPCC has done two smooths (and only reported one.) Here is my concordance to known series (from Osborn and Briffa 2006 versions): SW Canada- Luckman-Wilson Jasper/Athabaska/Alberta; W USA- Mann PC1; W Greenland – Fisher dO18; N Sweden – Tornetrask; NW Russia – Yamal; N Russia – Taimyr; Mongolia – Jacoby Sol Dav; E Asia – Yang composite. All of these are typical stereotypes (see for example my predictions for what Hegerl et al 2006 would use or Wegman Figure 5.8).
Note that Mann’s PC1 (shown here in black) is illustrated in IPCC AR4 as large as life, sort of like Chucky – I’m baaaack. Even the explicit statements in the Wegman Report and the NAS Panel that the Mann PC1 was calculated using incorrect and biased methodology was insufficient to kill off Mann’s PC1. Actually, it’s return is not just in AR4; as I’ve noted before, it’s been used more often in multiproxy reconstructions since being discredited (Rutherford et al 2005; Osborn and Briffa 2006; Hegerl et al 2006; Juckes et al 2007) than before. It’s as though the Team has gone pro-Chucky in a seeming show of solidarity against even the NAS and Wegman reports.
Figure 2. My emulation of IPCC Box 6.4 Figure 1 using Osborn and Briffa 2006 data, smoothed twice with gaussian 20-year filter. Chucky is shown in heavy black.
We all hear about how IPCC reports reflect the views of stadiums full of reviewers. Given that Box 6.4 Figure 1 used Mann’s flawed PC1, do you suppose that multiple reviewers drew this defect to the attention of the section authors? Well, surprise, surprise, only one reviewer actually commented on the Briffa spaghetti graph. You’ll never guess who. And his anti-Chucky comments were disregarded by the Team. Reviewer comments in italics; IPCC response in blockquote; today’s comments in ordinary face.
6-1114 B 0:0 0:0 As a matter of prudence, it seems risky to me for IPCC to permit section lead authors to publicize and rely heavily on their own work, especially when the ink is barely dry on the work. In particular, Osborn and Briffa 2006, which is by one of the section lead authors, was published only in February 2006 and is presented in the Second Order Draft without even being presented in the First Order Draft. Nonetheless, it has been relied on to construct the important Box 6.4 Figure 1. This is risky. Osborn and Briffa 2006 uses some very questionable proxies, including the infamous Mann PC1. I have also been unable to verify some of the claimed correlations to gridcell temperature. One of the authors’ excuses is that they incorrectly cited the HadCRU2 temperature data set, while they actually used the CRUTEM2 data set and that the some of the HadCRU2 data was spurious. This hardly gives grounds for comfort. The point made in Box 6.4 Figure 1 is also argumentative. If the relative warmth of MWP and modern periods is inessential to any conclusions reached by IPCC, I would urge you to delete this Figure and related commentary. [Stephen McIntyre (Reviewers comment ID #: 309-11)]
Noted, MWP figure changed. Although much of the claims in the comment concerning the proxies are not share, we have chosen to change the figure somewhat to reduce reliance on a specific paper.
What did they change? They merely reduced the number of proxies in the spaghetti graph. In what meaningful sense did that “reduce reliance on a specific paper”?
The caption says that Box 6.4 Figure 1 excludes “those with an ambiguous relationship to local temperature”. This is not the case as set out in some following comments. [Stephen McIntyre (Reviewers comment ID #: 309-38)]
See responses in appropriate sections
6-1143 B 29:14 29:14 One of the most prominent series on the right hand side of Box 6.4 Figure 1 is Mann’s PC1, which uses his biased PC methodology. It is so weighted that the series is virtually indistinguishable from the Sheep Mountain bristlecone series discussed in Lamarche, Fritts, Graybill and Rose (1984). These authors compared growth to gridcell temperature and concluded that the bristlecone growth pulse could not be accounted for by temperature, hypothesizing CO2 fertilization. Graybill and Idso (1993) also stated this. One of the MBH coauthors Hughes in Biondi et al 1999 said that bristlecones were not a reliable temperature proxy in the 20th century. IPCC Second Assessment Report expressed cautions about the effect of CO2 fertilization on tree ring proxies, which were not over-ruled in IPCc Third Assessment Report. At a minimum, the relationship is “ambiguous”. In addition, I tested the correlation of this series with HadCRU2 gridcell temperature and obtained a correlation of 0.0. Osborn and Briffa say that they themselves did not verify the temperature relationship for this data. Why not? At any rate, in this example, the authors have not excluded an important series with a well-known “ambiguous” relation to temperature. [Stephen McIntyre (Reviewers comment ID #: 309-39)]
Rejected the purpose of this Figure is to illustrate in a simple fashion, the variability of numerous records that have been used in published reconstructions of large-scale temperature changes. The text is not intended to give a very detailed account of the specific limitations in data or interpretation for each. Furthermore, though there is an ambiguity in the time-dependent strength of the response of Bristlecone Pine trees to temperature variability, there is other evidence that these trees do display a temperature response . Right or wrong, Mann and colleagues do apply an adjustment to the western trees PC1 in their (1999) analysis to account for possible CO2 fertilization. Other authors ( Graumlich et al ., 1991) assert that the recent rise in some high elevation conifers in the western U.S. could be explained as a temperature response (she can not confirm the LaMarche et al findings). The issue is clearly complex , as will be noted in a new paragraph on tree-ring problems that will be added to the text .
How absurd is this response – and see how tricky they are. Here they concede that there is an “ambiguity in the time-dependent strength of the response of Bristlecone Pine trees to temperature variability”. But didn’t they already say that the figure excluded those series with “an ambiguous relationship to local temperature”? They kept Mann’s PC1 in and changed the language: the Second Draft caption said that they excluded “shorter series or those with an ambiguous relationship to local temperature”. They changed this to read “exclude shorter series or those with no evidence of sensitivity to local temperature”. What did they drop from the Second Draft version? Four shorter series used in Osborn and Briffa 2006: Mangazeja, Tirol; van Engeln documentary; Quebec. They dropped two long series: Chesapeake Mg-Ca – used repetitively in the various studies; and the Esper foxtail version. I’ve taken pains in various comments not to limit criticism of bristlecones to CO2 fertilization issues – a point that seems prudent as closer examination of the Almagre data shows that the problem with bristlecones seems to be related to strip bark per se, rather than fertilization.
Graumlich 1991 is a bait-and-switch. Graumlich 1991 did not discuss Mann’s PC1, but other series which did not show a material increase in temperature. Yes, she did criticize CO2 fertilization, but largely on the grounds that she was then unable to discern the rise in ring widths claimed by Graybill in other high-altitude series. (The sites in Graunlich 1991 are unarchived and are different than the archived sites.) Graunlich 1991 also discusses a multiplicative response of foxtails to precipitation as well as temperature, noting that precipitation was the strongest factor.
6-1144 B 29:14 29:14 Another prominent series on the right hand side of Box 6.4 Figure 1 is a foxtail series (which interbreed with bristlecones) from a site within a few tens of miles from the Sheep Mountain bristlecone site. They do not explain why two similar series from so close are used, rather than being composited, if they are to be used at all. I checked the correlation of this data to HadCRU2 gridcell temperature and only obtained an insignificant correlation of 0.04. The authors said that they had cited the temperature data incorrectly, that they had actually used CRUTEM2 yielding a correlation of 0.19 and that HadCRU2 data was spurious in its early portion (1870-1887) because there was no station data. However there is station data at GHCN going back to the data in HadCRU2. D’Arrigo et al 2006 considered using foxtails and rejected the use of this data because it did not meet standards of being correlated to gridcell temperature, expressed in very similar terms to Osborn and Briffa 2006. The contrasting views of D’Arrigo et al 2006 certainly establish that the relationship is “ambiguous” and that this proxy should not be used on multiple grounds. [Stephen McIntyre (Reviewers comment ID #: 309-40)]
See response to comment 6-1143. Some of what the reviewer says may be true, but is as yet unpublished and the current review is based on multiple strands of evidence, among which the results of Mann and colleagues remains relevant.
Jeez, this shows one more time the problems of having lead authors promote their own work. In this case, the explanation came from Osborn and Briffa (recounted previously at CA) and came only after many requests to Sciencemag. Briffa is responsible for his own results and has an obligation not to report misleading results; whether I “published” these particular results is irrelevant to Briffa knowing that the observations were correct – which he more or less concedes – and then ignores.
6-1145 B 29:14 29:14 The beige series which has the strongest closing uptick in Box 6.4 Figure 1 is the Yamal series. When I plotted this series smoothing with a 30-year gaussian filter, I was unable to exactly replicate the uptick shown in this version. I checked the relationship of this series to gridcell temperature and was completely unable to replicate the claimed (0.49) correlation to temperature, obtaining only a correlation of 0.12. The authors here have used data from Yamal, while they used gridcell data from Polar Urals. There is an updated version of the Polar Urals series, used in Esper et al 2002, which has elevated MWP values and which has better correlations to gridcell temperature than the Yamal series. since very different results are obtained from the Yamal and Polar Urals Updated, again the relationship of the Yamal series to local temperature is “ambiguous” [Stephen McIntyre (Reviewers comment ID #: 309-41)
See response to comment 6-1143 and note that the Polar Urals and Yamal series do exhibit a significant relationship with local summer temperature.
6-1150 B 29:23 29:23 The same problems characterize these other studies as Osborn and Briffa. You should say: It is also possible that the proxies are so noisy that very little can be concluded from such graphs. [Stephen McIntyre (Reviewers comment ID #: 309-46)]
Rejected the presentation of data in the Figure in Box 6.4 allows the reader to gauge the hetergeneity of the data and the reference to Figure 6.10 (and text) provides the reader with a realistic interpretation of the analyses of these data.


19 Comments
Let me see if I get this. The graphs do not adequately represent the data, but their meaning is explained in the text. Is that a fair summation?
Right. Fake but accurate is coin of the realm.
Steve, you are right that “Chucky’s back”, despite “the explicit statements in the Wegman Report and the NAS Panel that the Mann PC1 was calculated using incorrect and biased methodology”.
Here is an quote from Colin Summerfield (Executive Director, Scientific Research, Committee on Antarctic Research, Scott Polar Research Institute, Cambridge, UK) in a ltter to “The Times” in response to Professor David Bellamy’s (anti) global warming article the previous day.
“David Bellamy has been pushing his anti-global warming barrow around for some time, peddling the same old mistakes (Comment, Oct 22). He apparently understand so little about the issue that he thinks that the hockey stick graph that shows a marked increase in global warming since 1900 was generated by a computer (it was actually a summary of measurements and proxy measurements), and he further thinks that it is wrong whereas it was vindicated not by a bunch of greenies, but by the US National Academy of Sciences.”
See (http://www.timesonline.co.uk/tol/comment/letters/article2725341.ece) for full details.
Chapter 6 really is the most amazing garbage. Any objective observer of Box 6.4 would deduce that the graphs are meaningless noise, as you rightly point out. And yet they use this nonsense to bash the MWP and criticise the excellent thorough work of Lamb, who had dared to suggest that the MWP was warmer than the 20th C. One of the most entertaining aspects of the fig is how the graphs head in opposite directions in the late 20th C, especially ‘N Russia’ and ‘NW Russia’, which one might think would be related.
I also like FAQ 6.2 “Is the Current Climate Change Unusual Compared to Earlier Changes in Earths History?”. I can answer this in one word of two letters. They take a page to not answer the question, ending up by saying that if temperatures go up 5 degrees this century, that would be unusual.
Is there a ‘new paragraph on tree ring problems’ as promised? Is it not obvious that tree ring widths depend on rainfall and sunlight etc as well as temperature?
Re#3, Summerhayes obviously has it wrong. But Bellamy does look foolishly ignorant with his claims that the hockey stick was a “prediction” based on data “only up to the 1850s.”
In the realm of “I can fit a random set of data to an elephant” – I can fit cores from trees with high angular variability in ring width to a hockey stick. It’s a no brainer.
Re 4. Considering the date of Lamb´s work, which I would guess is well esteemed by climate scientists, it is a tough game to take his work as a claim taking the last devades of warming (and science) into account. Science and time progresses, but some bloggers here seem to stay uninformed about both.
#7,4. I don’t wish to turn this into a discussion of Lamb. I agree with #7 that Lamb’s work precedes the recent warming. Of course the same can be said about the work from the Hockey Team, where, by and large, the proxy data ends about 1980, not all that different from when Lamb was writing, and as the Team likes to tell us (falsely), it’s too hard and expensive to update the proxies to see whether an out of sample test shows that they are capable of recording recent warming. The question here is whether the IPCC adequately justified the return of Chucky in Box 6.4 Figure 1.
I’ve read enough here to be convinced that tree rings are *not* a good indicator of past temperatures. Are there other proxies available with similar resolution for the timescale of 1000s of years?
#9. Ice cores are the closest candidate for annual resolution, but they have their own problems.
The most promising class of proxies IMHO – and ones scandalously under-discussed in IPCC AR4 – are high-resolution ocean sediment studies: see Stott and his school. They are probably more decadal in resolution, but dating depends on radiocarbon and is much more problematic. Higher resolution sampling on many cores looks feasible and well worth while. Is a lack of synchronism a sign of regionalization or a sign of dating uncertainty? Hard to resolve.
BTW I’m not totally negative on tree cores per se. I’m against Hockey Team cherry picking and biased statistical methods, but do not exclude the possibility that useful information can be obtained from them. But first the problematic statistical methods need to be confronted – the Team needs to start a Twelve Step program.
“Chapter 6 really is the most amazing garbage.”
Check out Chapter 4, similar issues to the tree reings re: temp proxy. According to Ch. 4 receding glaciers are a temperature proxy, advancing ones are anomolous and due to increased local precipitation. Advances in Greenland and Antarctica are glossed over and excused vaguely under the implicit argument “ice caps” are different than glaciers and worthy of little consideration. I.e., the IPCC doesn’t bite on the melt-water-lubrication or micro-quakes (Gore’s fave) explanation for advancing Greenland glaciers. Rather they submarine the issue, but provide the sense of a semblance of comprehensivity by adressing Antarctica and Greenland obliquely — side stepping the advancing glaciers but focusing on studies showing increasing melt water from them, and certainly not opining the increased melt is because the glaciers are bigger and advancing into warmer air near sea level.
The best proof I have that glaciers are advancing in Anarctica and Greenland is the IPCC’s tiptoeing around the issue. Really, the IPCC’s glacier stunts may beat their tree ring stunts for bad science. AR4 reads like a partisan lawyer’s summation at the end of a trial, not a judge’s measured ruling.
Re 11. Glaciers can advance either because they grow in the interior, i.e. have a positive mass balance OR because they surge which may be due to lubrication of the bottom because of increased melting. Changes in mass balance can either be due to changes in winter snow fall or summer ablation/melting. Therefore one has to consider each glacier by its special conditions. IPCC refers to the peer reviewed litterature on these issues, and of course there are diffferent explanations. #12 seems to think all glaciers act similarily. It is well documented that in Scandinavia, glaciers east of the continental divide are melting back in tandem with most other glaciers worldwide, due to increased temperatures, and because they are on the lee side of mountains and the prevailing winds that bring moisture in wintertime. The westward facing glaciers have grown due to the mild and wet winters of the 80-ies and 90-ies with plenty snowfall at their altitudes. Thus glaciers existing less than 50 miles from each other behave really different, one class grow due to warming and the other glass are reduced due to the same factors. A challenge to #12. If you think IPCC is not treating the subject correctly, document for us which glaciers are growing due other factors than surging or mild winters. Please provide references which is what IPCC must. If you cannot do this all of the posting remains uninformed accusations.
Perhaps we can stick to the tree-ring topic of the posting.
Yesterday, my wife gave a mini-presentation to her local Master Gardeners group on “what I did last summer.”
The group is linked by a deeply practical, science-based, understanding of the issues surrounding plant growth. These folks answer horticulture questions every day on behalf of the state agricultural extension… and do so for ordinary citizens who live in Colorado — at 1, 1.5 or even 2 mile altitudes. If it hasn’t been proven through research, they don’t even mention it.
And so, when Leslie mentioned that some dendroclimatologists think tree growth can be related more to temperature than precipitation, the room was filled with incredulous laughter — even from the ardent Gore supporters, etc..
They honestly couldn’t believe it, until Leslie reminded them that such perspectives are coming from people who aren’t biologists or master gardeners.
The crowd was fascinated that their own level of expertise might be useful in helping decode the puzzle of climate change.
[Update: just to keep the record straight, Leslie’s exact statement was that some dendroclimatologists think precipitation might not be the most important enabling/limiting factor in tree growth. (She was trying to be diplomatic and not emphasize the temp mistake too much.) ]
Re: 12 With regard to your challenge: It doesn’t work that way. For instance, you might say that jelly beans are the primary cause of cancer but I point out that your conclusion based upon a study of 20 kids in the cancer center is inconclusive because you didn’t test any kids without cancer. Your challenge to me to prove what causes cancer does nothing to bolster your position that jelly beans cause cancer. It is a challenge or comment intended to stifle debate.
Steve
When I spent a lot of time in the Las Vegas area in 2004 I had a chance to do a lot of hiking in the high mountains (around 9000 ft at Mt. Charleston). Near Lee mountain up there were some trees that had just been cut down. They clearly showed an increase in tree ring diameter in recent decades. I also found trees that had been cut decades ago that do not show the expanded rings. There is snow line data and temperature data available up there as well as for similar areas around Mammoth Mountain in the California High Sierras. I have spent a lot of time in the Sierras in the last 25 years and it is highly unlikely that there have been any temperature trends to explain the massive increase in yearly tree ring diameter at those altitudes. The ring diameter increases are more than double in most cases and are consistent. There have been several really snowy winters up there but the trees still have expanded ring growth.
RE: #13 and 15 – The problem is that the standard “understanding” of dedroclimatology is biased from the perspective of people in Europe and Eastern North America (where most institutions of higher learning are located). Even on these threads, we get people calling BCP areas “alpine” in the sense of the Alps or upper Apalachian spots. Places at altitudes which are considered “the alpine zone” here out west, are in some ways like ones in wetter and more temperate climes but in many ways they are not. In the case of the White Mountains (the ones in Inyo County, Calif) what’s below “timber line” is a very open wet – dry woodland mixed with scrub, very, very different from what one finds in Zermat or New Hampshire. In wet places, the temperature correlation may be real, but in our places which border deserts and semi arid lands, it’s moisture that is the main arbiter of success of failure.
LOL, that’s what I’ve been saying here for two years.
re #15
more snow, better growth … what’s up with that?
I have spent my 30 year career as a farmer in Western Europe. In all relevant cases, growth of plants takes place in the warm seasons, (hence tree rings). Moisture availability is therefore always the limiting factor; cool or hot, once the water runs out, that’s it. Did you ever see the experiment (I think it was David Bellamy) where a large tree was cut down and hydraulically lifted into a cattle trough fed with water by a fire engine and it’s team. They could not supply water fast enough to overcome transpiration from the tree. No water availability at tree root exploitation depth in any soil except arguably within artesian zones, could supply water faster than a fire engine pump. Therefore even in wet places, the correlation cannot be realistic.
3 Trackbacks
[…] among other things, the deletion of post-1960 Briffa reconstruction results – see for example here here here, where the lead author (Briffa) justified the deletion of adverse post-1960 results from […]
[…] ICC AR4 and the Return of Chucky – He’s Baaack! […]
[…] was made up of data the National Academy of Scientists said should be avoided. Despite this, it was included in the latest IPCC […]