Briffa 2000 is one of the canonical “independent” reconstructions in the IPCC AR4 spaghetti graph, the Wikipedia spaghetti graph and similars. I’ve discussed it in the past, but I’m going to revisit this in light of the new information on Tornetrask and I’m going to run Brown’s inconsistency statistic on it.
Briffa used 7 series: Tornetrask, Taymir, Alberta (Jasper), the Jacoby North American composite, Yakutia, Mongolia and Yamal (replacing Polar Urals). Most of these series have been updated since Briffa 2000: indeed the updates were available. Tornetrask was updated in Grudd’s thesis; Taymir is relatively up-to-date; Rob Wilson updated Jasper, Alberta; Yakutia is updated – it;s the Indigirka River series in Moberg; Mongolia is updated; the Jacoby composite should be updated, but important series from D’Arrigo et al 2006 remain unarchived. Although there are hundreds of measurement data sets at ITRDB, these measurements are, for the most part, conspicuously absent: Tornetrask(other than a subset archived by Schweingruber); Taymir; Luckman’s Jasper, Alberta; Yakutia; Yamal. JAcoby’s Mongolia is archived and some of the Jacoby data.
Replication
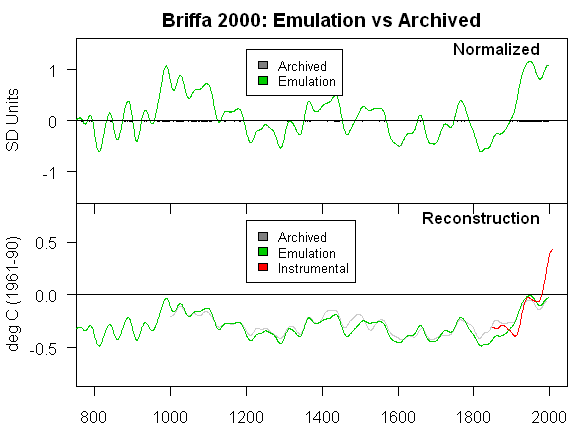
The chronologies used in Briffa 2000 are available and I could exactly replicate the “normalized” composite as shown in the top panel below. The Briffa 2000 “reconstruction” was archived in connection with the Briffa et al 2001 but does not match the normalized composite, though the methodology is supposed to be only a linear transformation. When I reproduce the reported method, I get a somewhat different answer. I have no idea how Briffa got from his normalized series to the archived reconstruction. For replication purposes, I’ve used the replication algorithm that yielded the bottom panel, which is the best that I can do right now and works adequately enough for sensitivity.

Figure 1. Top – emulation of normalized series (exact!); bottom – emulation of archived reconstruction, Not exact.
Sensitivity
For a sensitivity analysis of the impact of updating, I did the following updates (Taymir is pretty up-to-date. Only the Jacoby NOAMER series is not millennial. )
Tornetrask – the Grudd version;
Yakutia – the version used in Moberg, which extends to a millennium series;
Polar Urals – Esper’s Polar Urals update, rather than the Yamal substitution;
Mongolia – updated version used in Osborn and Briffa 2006
Alberta – Luckman-Wilson updated version used in Osborn and Briffa 2006
This yielded the following two panels – the top being the normalized composite in the same style as before and the bottom being the temperature reconstruction.
In this rendering, the maximum is in the 11th century, with an elevated modern period in the 1930s. The sensitivity version and the archived version are very close through the 19th century but their early trajectories increasingly diverge. Whereas the modern period was the warmest using older data, the 11th century is “warmer” here. This result is not “independent” of a similar result for the Jones series as key series overlap – but this non-independence existed already. Also the “divergence problem” is noticeable, especially recently where ring widths have not responded to very warm recent temperatures, raising questions about the ability of these proxies to record possible past warmth. Replacing the Polar Urals update with Yamal attenuates the MWP relative to the modern period.
Brown-Style Statistics
Next here is a plot of Brown’s Inconsistency R(b) for the original Briffa network over the period of 100% representation (1601-1974). This shows rather dramatic inconsistency in the 19th century (and not so much in earlier periods). What does this signify? Dunno.
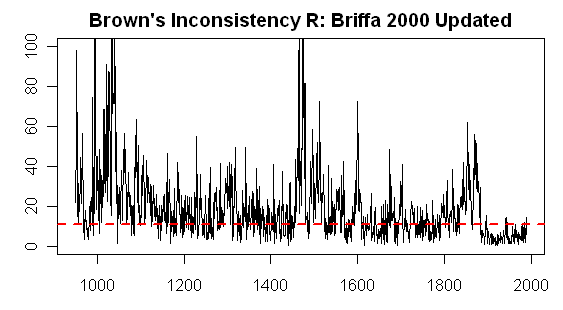
Next here is the same thing for the 6 series network of millennium series (here from 950 to 1990). Again this shows far more coherence in the modern period than in earlier periods. Prior to the 20th century, the inconsistency values are running at levels consistent with random data (the red line), with coherence existing only in the 20th century. Why is this? Dunno. These results certainly indicate that efforts to “reconstruct” past climate from this data are doomed, but I’m still feeling my way through this style of looking at the data.
“Reconstruction”
Here are maximum likelihood and GLS reconstructions (smoothed 21 years).


10 Comments
So there’s actually a good case that in the year 1000 temperatures could have been over one degree above today inside SD1? Or is it even higher?
Steve: I’d be more inclined to say that this shows that this stuff doesn’t show anything.
Sorry, one CR too early. But was just wondering wether those kind of corrections can give better consistency for the last century or two?
Why might there be more coherence in recent than in past times? We might ask instead whether conditions are likely to remain the same for an individual tree over time. The answer is no. Over 1000 years, the neighboring trees that compete with the sampled tree are likely to come and go (grow up and die), the sampled tree is likely to have been damaged and recovered perhaps several times, ground fires can remove ground cover which regrows, etc. That is, the same tree in no sense of the word can be guaranteed to have been growing under the same conditions of shade and moisture or of health over the period in question, especially for 1000 years+. Thus an individual tree’s response to climate in 20th Century is not likely the same as it was 800 years ago. Thus coherence even within a tree will likely go down as we go back in time and a priori we can expect the same for between site coherence. There is nothing magical about increased coherence in the most recent period. It is expected for trees. It might mean something for a purely physical process like boreholes or something.
#3
Craig, you’re preaching to the choir. The underlying assumption that tree rings widths/densities are linear in annualized temperature (after age correction) over 1000 years is an extraordinary claim. Yet Mann and others make this assumption about their proxies without proof. Other climate scientists including NAS appear to agree or doesn’t care as Mann et al gets the “right answer”.
You’ve suggested an interesting point about “a purely physical process like boreholes or something.” I will suggest that the readers consider an inconsistent linear set of equations Ax~B, where A is an ill-conditioned matrix to the point that the max to min singular value ratio is greater than 1e7. Would anyone suggest that the solution for x be unique or the “correct answer”?
For the borehole temperature reconstructions of Hugo Beltrami and et al, B is the vector of borehole temperatures vs depth, the elements of x consist of the temperature reconstruction plus a slope and intercept, and the columns of A are generated from the heat conduction physics equation. Noting again, that the A matrix generated from the physics equations is ill-conditioned. Seems like the physics are suggesting something??
In the borehole literature, the x or temperature reconstruction is solved by performing a truncated least squares fit (svd psuedoinverse) and throwing out singular values until (drum roll) the hockey stick is generated. These results have been in peer reviewed literature for 20 years. Recently, to avoid the appearance of just throwing out singular values, the latest literature performs a ridge regression (RegEM) where singular values from the ill-conditioned matrix are thrown away such that they “optimally” trade off the norm of the residual for the norm of the x vector. Not clear why anyone would think that this answer is the “correct temperature reconstruction” or even that this is the correct answer plus noise. Now, if I was determining the “optimal” feed recipe for my chickens, one might have something.
Phil. B: thanks for that about boreholes, I hadn’t thought of that, being more oriented to trees in training. There are other examples of more purely physical processes used for proxies. For example, in the S. Africa cave data, the color of layers laid down is related to surface temperature via a leaching process as rainwater passes through litter and soil, kind of like making tea–hotter is darker leachate. So this would be an example.
Cry for help. Does anyone have evidence that uniformitarianism can be extended over several thousand years for data like temperature proxies? I suppose that a number of proxies, using different principles, that give similar patters (like Craig’s data set) add some support, but I have this uneasy feeling about confounding factors changing the response of some methods over long terms. It’s easy to dream up hypotheticals, (like rain, heat, N, P, K, CO2, SO2, pest damage, strip bark, crowding/shading, trace elements, fire, termites, competition for the above, etc., in dendro) but that does you no good – it makes you worry a bit more.
Re boreholes, the Russians did a lot of temperature work on the Kola Peninsula and found difficulty in both measuring and correlating boreholes close together. IIRC, they did not recommend climate temperature reconstructions.
Where does increasing sophistication in statistics meet altered sensitivity in reconstructions of proxies in general? Are we there yet?
The answer is dependent upon how much resolution of detail you want within your millenia of samples.
Re #7 D. Patterson
(Chuckle). In my career times, we banned geological statements that commenced “It all depends…” and also mathematical explanations that started with a written triple integral before speech.
The serious answer to yopur question is that I want accepted proxy methods to have valid error ranges that overlap with a good degree of confidence; a scientific attempt to explain isolated, unexpected outliers; a resolution of detail commensurate with actual rather than interpolated sampling frequency; proxies that do not drift unexplainaby from each other with the passage of time; a calibration statistic that exceeds the variance of the test period; a demonstration that the proxy is different to noise; and a quantification and sensitivity test of the most likely hypothesised or actual interferences.
That’s just a start, but it is not unusual.
Re #8 Geoff Sherrington – It sounds like geology has tightened up a bit since my intro course back in the sixties where the standing joke was “One outcrop + two geologists = 3 theories”.
ROTFL. Money well spent!