OK, I’m starting to get the feel of the new proxy network and have some ideas of what the new Mannomatic is doing. The manouevres have a lot of similarities to the moves in MBH98 and I think that a few main components can be singled out:
1. Once again, as in MBH98-99, the “proxies”, as a network, do not have a strong common “signal” and the HS-ness is contributed by a very small minority of the proxies.
2. In proper data analysis, if one knows that the load is actually carried by a small number of proxies, then the analyst has to put these under the miscroscope to ensure that these are really good proxies – well-studied and endorsed by their original authors as temperature proxies. Once again, we get the opposite. As in MBH98-99, the load-bearing proxies are very problematic and, as previously with the Graybill strip bark chronologies (which remain in use), known defects are ignored using contrived excuses.
3. In this case, Mann notes caveats by the original authors (e.g. Lake Kortajarvi), but, once again, does a typical Mannian calculation, purporting to show that he can get a similar answer without the flawed data, begging the question of why the flawed data was used at all, if it doesn’t “matter”. It’s not as though the selection criteria for this grabbag network are clearly expressed. In this case, pardon me if I assume for now that the flawed data does “matter” as we found out with MBH98, where any attempt to do a sensitivity analysis without the
4. Remember that even Mannian RegEM still results in linear weights for the underlying proxies. So if Mannian EIV, whatever it proves to be, ends up being more-HS like than Mannian CPS in the non-dendro network, as seems to be the case, this merely means that Mannian EIV concentrates the load on the HS-shaped proxies and thus “gets” a more HS-shaped result. Exactly how this is done within the algorithm is unclear right now, but, based on present information, we already know that this happens.
This is precisely the sort of issue that was encountered with Mannian PCA/regression. If more load was placed on the bristlecones, he could “get” a HS. Given the heavy load borne by the bristlecones, any sensible statistical program would then assess whether they were a good proxy. Instead the Team used contrived arguments that given heavy weights to bristlecones was statistically “right” and “proper”.
This is going to go down the same road. The flash figure below (presented in an earlier post) shows standardized versions of the 41 non-dendro series starting on or before 1010 that contribute to the early reconstruction.
You can see that the following series contribute most of the HS-ness: the 4 Kortajarrvi lake sediment series (all from the same study); 3 Thompson ice core series – Dunde, Huascaran and especially Dasuopu; the Agassix melt series (also an important contributor to Moberg); an unpublished Socotra Island, Yemen speleothen dC13 series and a Scottish speleothem.
If these 11 series receive more weight, you get more of an HS and conversely.
Kortajarrvi
We already have a thread on the Kortajarvi sediments containing observations by two Finns. As noted above, the original paper noted anthropogenic disturbance to the lake sediments – something that is quite common.

Mann admits problems with this data. So why is it used and not just once, but 4 times? Mann:
we also examined whether or not potential problems noted for several records (see Dataset S1 for details) might compromise the reconstructions. These records include the four Tijander et al. (12) series used (see Fig. S9) for which the original authors note that human effects over the past few centuries unrelated to climate might impact records (the original paper states ‘‘Natural variability in the sediment record was disrupted by increased human impact in the catchment area at A.D. 1720.’ and later, ‘‘In the case of Lake Korttajarvi it is a demanding task to calibrate the physical varve data we have collected against meteorological data, because human impacts have distorted the natural signal to varying extents’). These issues are particularly significant because there are few proxy records, particularly in the temperature-screened dataset (see Fig. S9), available back through the 9th century. The Tijander et al. series constitute 4 of the 15 available Northern Hemisphere records before that point.
In addition there are three other records in our database with potential data quality problems, as noted in the database notes: Benson et al. (13) (Mono Lake): ‘‘Data after 1940 no good— water exported to CA;’ Isdale (14) (fluorescence): ‘‘anthropogenic influence after 1870;’ and McCulloch (15) (Ba/Ca): ‘‘anthropogenic influence after 1870′. We therefore performed additional analyses as in Fig. S7, but instead compaired the reconstructions both with and without the above seven potentially problematic series, as shown in Fig. S8.
Mann’s SI Figure 8 shows no difference with/without these 7 series in the CPS version, but the EIV version is affected. This figure appears to be a splice which hides the impact on the reconstruction using the MWP proxies, which, after all, is the case of interest to readers. SI Figure 8 should be shown using only the MWP proxies, as this is all that are relevant for the MWP-modern estimates.
Secondly, this figure appears to include both dendro and non-dendro proxies. Now much attention has been paid to problems with tree ring proxies, but there is a special issue with the validity of the Graybill bristlecone chronologies, which continue large as life in this study and carry lots of weight in the SI Figure 8 comparison. We know that Ababneh didn’t replicate Graybill’s results at Sheep Mountain, but, instead of using this up-to-date, Mann and Hughes have continued to use the problematic Graybill strip bark series. Even though this issue was raised by the NAS panel, flaccid reviewing failed to pick up even such an obvious point.
If there is a little diversification among the flawed “proxies”, then a few of them can be removed, with others picking up the slack.
In being critical of these particular proxies, I’m not objecting to them merely because they are HS-shaped. What I’m doing is simply isolating the HS proxies for closer scrutiny – a proper data analysis procedure – and checking the underlying literature and rationales. Clearly Kortajarvi and Graybill strip bark are not great great foundations.
What about the other “load-bearing” proxies?
The Thompson Three
We’ve talked previously about the three Thompson ice cores: Dunde, Huascaran and especially Dasuopu.

I’ve observed that Mt Logan in the Yukon and Law Dome in Antarctica do not have a HS pattern. Though long versions of both these series are available, Mann doesn’t use them: why? Or for that matter, why aren’t Puruogangri and Bona-Churchill used? Oh that’s right, Thompson hasn’t archived anything for Bona-Churchill yet. I’ve commented on these series in other threads – see the Thompson category and will not do further right now, other than to note that these series are very important in a non-dendro HS through the MWP, especially when the ridiculous Kortajarvi data is removed.
Socotra Island dC13
Without the above 7 series, the HS pickings get pretty slim. Here is the Socotra Island dC13 standardized as before:

The Socotra Island speleothem results are unpublished for this period. Mann’s reference is to a study that does not discuss or present this information. The data is from Bradley’s group and is not archived. I have seen no evidence that dC13 speleothem values can be relied on as a climatic proxy; there are some caveats in specialist literature against trying to use dC13 for climate. Fleitmann, one of the Socotra Island authors (within Bradley’s group) stated:
d13C values of speleothems are difficult to interpret in terms of climate variability and only a small number of samples show AGLs. Consequently, most of our paleoclimate records in Oman and Yemen are based on d18O alone.
and goes on to say:
Calibration against meteorological observations: A handful of meteorological record is available for Oman and Yemen. Unfortunately, all of these records are geographically widely distributed, generally shorter than 40 years and fragmentary. Due to the lack of meteorological observations, a calibration of our speleothem records is not possible.
This caveat wasn’t a problem for Mann who reported correlations of 0.51 (1850-1996) and 0.71 (1850-1949) for the Socotra Island dC13 record. Mann went on to say:
One advantage of the non-tree-ring proxy series used is that, in most cases, there is little reason to believe a priori that there are any problems with the series that are likely to eliminate the reliability of multicentury to millennial time scale information.
Once again, an assertions made out of thin air. You can’t just say things – they have to be shown with technical reports.
Scotland Speleothem
The last one that I’ll comment on briefly today is a Scottish speleothem. Here there seems to be a long-term within the record. I’ve noticed that speleothem data sets sometimes remove such trends as sometimes being due to physical causes – is something like that going on here? This is the sort of thing that Mann et al need to report on.

This is a pretty ragtag collection of proxies upon which to found claims that they can “get” “skilful” reconstructions without Graybill bristlecone chronologies. And oh yes, wouldn’t it be nice if Thompson archived a complete data set – all samples and all measurements – so that a proper analysis of the Thompson Three could be carried out.


98 Comments
FYI, addition to my lake Korttajärvi contribution, which I sent to RC (No 55), with Gavin Schmidt’s response, as follows:
The authors of the study explicitly state
“. Natural variability in the sediment record was disrupted by increased human impact in the catchment area at AD 1720.”
Ref: Tiljander, Mia, Matti Saarnisto, Antti E. K. Ojala and Timo Saarinen, 2003. A 3000-year palaeoenvironmental record from annually laminated sediment of Lake Korttajärvi, central Finland. Boreas, Vol. 26, pp. 566–577. Oslo. ISSN 0300-9483, December 2003
When the study was published I discussed with Mia Tiljander and she stated that human impact, especially land cover change, agriculture, accelerates erosion, more material flows to lake sediments, and thereafter the lakes are of no use in proxy reconstructions anymore, Korttajärvi from 1720 on, most of the other 180.000 Finnish lakes from 1850s on.
[Response: That is, I presume, why Mann et al did a test that didn’t include them. – gavin]
Steve: you may want to snip this, which is fine,
Just left this over at realclimate: “I’d be real careful, If I were you, Gavin, about how far you go in defending Mann’s latest bit of incompetence; because McIntyre is slowly but surely tearing it apart, and it’s beginning to stink like a mackerel in the moonlight.”
Let’s play a game. I will choose to vigorously defend Mann et al 2008, once I get around to reading it. Then, under your constant attacks, I will see how long I can maintain my charade before I either (a) get sick in disgust with myself for all the dodging and distortion, or (b) start to convince my former self that my new Mannian self is actually right.
Great work as usual. I have just one question: Mann’s latest has been mainstream news all around Europe (and the rest of the western world I’d presume) and millions of people, including policy makers are taking it at face value – now, how could this other side of the story get wider exposure? CA’s readership is vast for a website, but still the circulation of this important information remains relatively peripheral.
Copenhagen 2009 (“Kyoto II”) is only a year away, and potentially some of the biggest economic decisions in the history of mankind await us. You’d want them to be based on sound science. How to circulate this information?
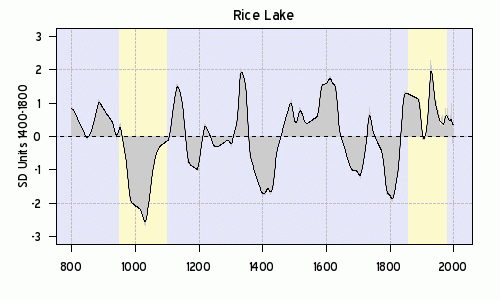
Theres not much in the way of signals for a MWP either. China, Mexico, Ecuador and Costa Rica are the main contributors. Not quite northern hemisphere warming and far less a European warm period. Greenland seems to show no variation at all. This huge disparity between proxies was also in Craig’s data. It suggests to me that, with or without stats, there isn’t much evidence of any consistent warm or cold period anywhere. Cold comfort for MWP enthusiasts. Mann’s reconstruction doesn’t even show a hockey stick anyway until you tack on the instrument record. So it all comes back again to the instrument data – was it just as warm in the 30’s prior to those adjustments or are we really heating up abnormally?
I have spent the last two days immersed in climate reconstruction. The further I get the worse it gets. I can’t wait to see how these curves are weighted compared to the rest.
I really had no idea that the science was this crazy. I can’t get my head around how you throw out perfectly good data which has a poor fit at the end of a graph while keeping other perfectly good data using the same method which happens to have an upslope. It gives you a better hockey stick but I don’t see how it’s justified. Also, why would you keep known bad data? The more confused I get the more clear the answer gets.
I noticed he uses a single sided P correlation for eliminating most of the data, am I correct in saying that a single sided positive slope correlation rejects data with a negative slope component more strongly? Does anyone know how that is justified?
Re: Jeff Id (#6),
Gavin answered this point thusly when I queried his criticism of Craig’s reconstruction – “Neither was it calibrated to any modern record, so no comparison between his MWP and the modern was possible”.
So the rationale is not to mine for hockey-stick shapes, it is to get a reasonable wiggle match in the early 20th century so that you can happily tack on the instrument record and show a reasonable overlap. In one sense this is a correct procedure but it’s far from ideal. However since it’s not apparently easy to calibrate against local temperatures, they go for a global match. Alternatively they could show the data with no instrument record at all but that wouldn’t demonstrate an urgency for action to policymakers.
Re: JamesG (#9), Re: Gavin’s criticism of my paper–“neither was it calibrated to any modern record” what I did was take proxies that had ALREADY been calibrated to local temperature and find their mean over time, just like you would do with instrumental records. If Gavin thinks one should calibrate a local proxy to a global record like CRU, then he belongs to the church of teleconnections.
Re: Craig Loehle (#23),
Craig
That’s pretty much what I pointed out to Gavin in my defense of your paper, except I had to ask it as a question; something like – “isn’t combining proxies pre-calibrated to their local environment better than wiggle matching them to a global record?” – in order to get a response. No criticism of your work was given by me at RC, or intended here.
what it the probability that this ‘procedure’ that turned all these proxie’s into a temperature reconstruction were developed a priori with no idea (or preference?) to the outcome? Isn’t there something much simpler (or perhaps just something with statistical precedence) that could/would be done with this set of proxies to develop a reconstruction? Presumable there are *many* variations of similar type statistical treatments that would result in different outcomes. Is there any question that Mann 2008 was not conducted in some sort of reverse engineering (or trial and error) mode with a result in mind?
Point (or component) #3 seems unfinished.
As we don’t have unthreaded at the moment… I can’t see why Gavin couldn’t see my contribution as helpful over on RC, but it’s not a policy discussion, it’s more a scientific comptence question – it didn’t seem to get through moderation for some reason. Reading Steve’s take on MBH2008 – makes you wonder if there are N degrees of freedom being exercised in another place… Or are they really that dense.
# Andy Says:
3 September 2008 at 10:58 PM
You had a review of Craig & Lohle on …..
[Response: The problem with the Loehle method is that there was no validation of his results and no attempt to adjust for fidelity of any proxy – they were all uniformly thrown in (and that’s distinct from all the dating and interpretation mistakes that were made). Both the methods used in Mann et al have calibration steps and cross-validation and only CPS requires a local response to temperature. – gavin]
Gavin have you ever considered that you are sounding more and more absurd by the day.
snip
Am I the only one that actually feels a bit sorry for Mann? Imagine knowing that an entire blog, operated by a highly qualified critic of your work, is dedicated to scrutinizing your every method and calculation.
Of course looking at it another way, it would be rather flattering, not to mention helpful, if you were an honest scientist interested in the validity of your scientific work. (i.e. Loehle)
Imagine how all of science could advance if this much interest and brain power could be brought to bare on every field of scientific inquiry.
Re: Lance (#11) wrote:
No need to feel sorry for Mann. He probably feels more sorry for you. Acually, he’s probably laughing his head off at you. What he’s said is being broadcast all round the world, but nobody has heard of you.
Buddenbrook (#4) asks the right question:
I’ve now read all the comments posted here since 2 Sep, and an incredible job is being done. But what good is it if the news of this emerging demolition only filters out gradually across the web over weeks, months, or years? Sure, Mann’s original Hockey Stick got demolished, but how long did it take for that news to spread all round the world? Now he’s just releaseed a brand New *Improved-Formula* Hockey Stick, and the whole process has started all over again, just like resetting a computer. I come here fairly regularly (every few weeks or so), but I only found out about this story yesterday in the mass media, and only came running here then because I knew where to go.
The web grinds small, but it grinds exceedingly slow. You’re going to have to get your response out faster, or there’s no point in getting a response out at all. I suggest 3 measures:
1) Create a list of interested subscribers who read and admire this blog but seldom actually comment. (i.e. people like me)
2) Email them in an emergency (like now) and tell them to get their sweet little asses out onto every newspaper/blog comment thread or discussion forum they know to spread the message.
3) Give them a prepared message to distribute. This can just be a summary of what’s been produced to date in a rapidly developing situation.
snip –
If you had got some sort of system like this going, you guys are so damn fast you’d have killed off the latest Hockey Stick on the same day the story broke.
Hey, just my 2 bits.
Steve: First of all, I’d like to think that I’d be prepared to recognize and acknowledge good methods and good proxies even if they come from the Team. I hope that I’m criticizing the methods and not the answer. I’ve always been careful not to preclude the possibility that someone could prove the Stick using some other method and better data; I’ve limited myself to analysis of statistical methods and have not felt that I’ve been in a position to argue an alternative MWP-modern relationship without risking “apple picking”, as opposed to “cherry picking”. Second, and many readers lose sight of this, the sort of analysis done here is a two-edged sword. It has been said to me – if the Stick is wrong, then the situation is much worse than we think it is because the sensitivity is greater. My answer is – well then, we should know where we stand and govern ourselves accordingly; others besides me should inquire into these concoctions. Third, it doesn’t bother me in the slightest if Mann gets his day in the sun. If no one cared about these reconstructions, it would remove some of the interest that people take in the analysis done here.
Please keep in mind that I post up a lot of material, most of which are just my thoughts as I work through a problem. 99% of the time, there isn’t any “message”. Right now, I’m just working through this particular study and this exercise might take me a couple of months.
I’m surprised that I’ve got as large an audience as I do, but there seems to be interest in both the process of working through these things as well as the answer. What’s a bit unique about this blog is that the process is laid out in full view. There’s always a tension between readers who get angry about things and readers who enjoy the crossword puzzle approach. In my opinion, many readers are far too angry about things and often project their own angriness onto me and onto the blog – something that I try pretty hard to discourage, a message that you should keep in mind.
Oops, meant “brought to bear” of course.
I think there is little censure in realclimate these days.
Steve, just a quick comment to back up Fleitmann’s concerns about using dC13 of speleothem carbonate as a proxy for temperature. Considering the physical chemistry of speleothem deposition the dominant control on dC13 is the rate and extent of CO2 degassing of the precipitating water. This is most clearly demonstrated if one measures d13C along a single growth layer of a stalagmite. The drip falls on the growth axis and then runs down the flanks of the speleothem surface. d13C evolves towards more enriched compositions along the flow path as 12C is preferentially lost in the exsolved CO2. Similarly, on a larger scale if the ‘plumbing’ system in a cave changes in response to, for example, changing precipitation patterns then one would expect to see variation in d13C resulting from varying extent of CO2 degassing. Put simply d13C is not a proxy for cave temperature.
Conversely, if one carries out the same test for d18O one hopes to find that it remains constant. This is the basis of the famous Hendy test to check if a speleothem is growing in thermal isotopic equilibrium with it’s parent drip water. A plot of d13C versus d18O for samples taken along a single growth layer should reveal that the two are decoupled and not correlated.
For what it’s worth I have measured few speleothems in which the oxygen isotope composition can be unambiguously demonstrated to be in isotopic equilibrium with it’s parent drip water.
Finally, having identified a speleothem that has grown in isotopic equilibrium, when trying to interpret the speleothem d18O record one must always be aware that both the precipiation/groundwater d18O and temperature exert a control on the final d18O composition. This is why we have spent many years trying to develop robust analytical techniques for recovering both carbonate and associated fluid inclusion d18O.
Gah. I know it has been said over and over, but I still can’t believe this stuff.
Find a bunch of local proxies with a vague correlation to modern global temperatures, then extrapolate them into the past to declare that today is hotter than ever before.
Well, duh. The modern correlation is most likely spurious (what’s the mechanism for a local proxy to correlate with global temperature???). So you’re just averaging a bunch of random curves that happen to show an uptick over the last hundred years, which means you’re combining random noise for the piece before the modern period, hence expect them to average out to zero in that period. Of course, since you’ve deliberately selected those proxies that show an upwards slope recently, you end up with a flat past and a recent uptick: ie a hockeystick.
But so frigging what? I bet I could select proxies with a recent downward slope, average them together, and get myself an nice inverse hockeystick. Would that prove the earth is colder than it’s been for the last 1000 years? Of course not.
If they could produce one, just one good proxy that clearly tracked the modern instrumental local temperature, then I’d be interested in what that proxy had to say about temperatures in the past.
Urrrgh. I feel ill.
Re: mugwump (#15),
Please do so. Once your illness passes.
JamesG
Thanks for the reply. I understand that they are trying to make the match to recent temperatures, but this method guarantees an overly peaked endpoint. If noisy data cannot match current temperatures naturally through averaging and the data cannot be scrapped for poor collection or contamination then you cannot discount the data.
These series have flaws (inaccuracies, noise) of varying degrees throughout their entire length. To think of it simply, if you keep only the sets with an end shape like you want, this shape will become the most pronounced while the natural noise in the rest of the graph when averaged will have a flattened signal.
If we are to believe this is the only way to sort the good data from the bad, we cannot compare the distant historic temperatures magnitude to the calibration period magnitude to form conclusions. They are on different scales.
Bender is already acting in Manniesque way. Hehe
Re: Luis Dias (#18) You mean Gavinesque. Please get your terminology straight before commenting.
When he says that he can get the same results without relying on the flawed data, what does he mean? Does he (say) take 8 sets of flawed data, and then remove them one-at-a-time from the overall set, to “prove” that the other seven still have the same overall result?
Re: Spam (#19) The robustness test is fully described in the SI. Next time try reading before commenting.
Steve: Your Mannian voice was not quite on tune. Surely you meant to say that it was fully described in Mann et al., “Robustness Tests in Paleoclimate Reconstructions”, in press (which will eventually appear in 2011).
Truly sorry, oh brightful one.
For those of you who grew up in the ’60s, the Peter, Paul and Mary song seems so apropriate:
“When will they ever learn, when will they eeevvv-errr learn”
Bender,
Thank you for taking on the thankless task of skeptic demolition. I have a few questions which I am sure have obvious answers, but I am a bit puzzled.
In the charts below I have plotted the average of the original proxies (no infilling) after scaling to -1 to 1 against the number of contributing proxies. The scaling gives them all equal weight. Why does the proxy average start going up exactly when the number of proxies starts going down? From 1980 to 2000, the fewer the proxies, the steeper the average. Doesn’t fewer proxies mean less reliability, just when the most certainty (the 20thC) is needed?
Any illumination much appreciated.
#26. The Luterbacher instrumental non-proxies continue closest to the present. They have a sharp upward trend in the 1990s reflecting European instrumental temperatures. I’ll bet that they accout for much of what you observe.
They really shouldn’t be in a “proxy” network. Mann has an analysis that purports to show that their inclusion doesn’t “matter”, but I have little confidence in this assertion. If they didn’t matter, why use them? My guess is that they impact the “infilling” of non-uptodate proxies and that the removal analysis tests networks in which Luterbacher was used to infill other data, not a network with no use of Luterbacher whatever.
#28
Steve’s work obviously needs time and accuracy. By nature, Mann and company have had months to prepare their PR and know when their paper will hit the stands. I do believe the factual, argumented rebuttal Steve is providing should receive world media coverage within a reasonable time frame. But in my opinion, innuendos and loose language should have no place here.
For what it’s worth..
SU-96-7 (from Baker_2002, above) can be found at ftp://wdc.obs-mip.fr/paleo/speleothem/scotland/scotland_data.txt
The text file lists the raw and detrended data.
“Historical Calibration against Instrumental Records (1879-1990 AD):
Using decadal smoothed data we observed a clear positive correlation with
temperature (r=0.49) and negative correlation with precipitation
(r= -0.53; both significant at the 99.9% CI). Combining these results,
a linear regression of band width against temperature/precipitation (T/P)
using decadal smoothed data yields the following empirical formula:
Annual band width = -4.637 +1508 (T/P), (r=0.80).
By assuming a mean and ± 2 sigma values for annual temperature
of 7.02 ± 0.43 °C for decadal smoothed data for the last 1100 years, we
have reconstructed mean annual precipitation and North Atlantic Oscillation.”
Steve: I didn’t express my issues with this proxy as well as I might have. In the case of Scotland, we actually know something about the MWP and even the most avid advocate of a “regional” MWP includes Scotland in the “region”. But this proxy, used in temperature reconstructions, implies a cold MWP in Scotland or maybe a cold MWP in Madgascar or Australia or Timbuktu, depending on what teleconnection channel they use in this particular cave. The series looks to me like it has a long-term “drift” that might very well be non-climatic e.g. something going on physically with the structure of the speleothem, something that I’ve seen adjustments made for in other places. Calibration in the instrumental period would not be sensitive to such a hypothetical drift, but that’s what concerns me.
Re: IainM (#29),
Steve: this speleothem has been discussed previously on CA at http://www.climateaudit.org/?p=817 starting at post #95.
At that time it was discussed in the context of a 500 year temperature reconstruction and the question was asked ‘why not go back further’, personally I think the answer to that should have been ‘because it’s a useless proxy’
Bender, where is thy scathing rebuke? Instead, I am illuminated by SteveM. Here are the averages with/without the lutannt series. In the SteveM collation of 1209, there are 71 lutannt series. In the zip of the original unpadded (though still infilled) proxies there are 89. I have all 89, scaled from -1 to 1. The uptick from 1980 as the proxies drop off fades away without the lutannt series.
Please explain – Why are the luannt series not the sine qua non of this reconstruction?
Re: DaleC (#30),
You take a break for 24 hrs … and this is what you get. What is it exactly you want a response on? I saw no references in your comment.
Re: DaleC (#30),
Further to the above, this time the averages for lutannt are from the 1209 set, so only lutannt1 to lutannt71. Proxies are scaled between -1 and 1. Series are rolled to improve visibility of the end points and to reduce overlap.
Does anyone know the provenance of lutannt72 to lutannt89?
Steve’s comment above to idlex:
The argument that a substantial MWP implies increased 2xCO2 sensitivity is one of the more common sneering points we hear from the realclimate crowd. But increased sensitivity isn’t the only explanation. The natural variability may be much greater than currently believed. Or the earth may have different sensitivities to different phenomena – eg it may not have the same sensitivity to 2xCO2 as it does to whatever forcing (if any) caused the MWP.
In this vein, Douglass and Knox’s work on Pinatubo seems to imply that volcanic forcing sensitivity differs from 2xCO2 sensitivity, which makes a lot of sense given that Volcanos belch enormous amounts of stuff into the atmosphere which could affect things like cloud formation.
“The clearest climate-dependent time period is the Medieval Warm Period, AD 980-1250.”
and
“The natural sedimentation is disturbed since cultivation increased in the area after the early 18th century.”
As a total newbie in this level of discussion, these exerpts from summary of Mia Tiljanders doctoral thesis concerning Korttajärvi sediments just caught my eye. My five cents, keep up the good work!
Holocene sedimentary history of annual laminations of Lake Korttajärvi, central Finland
https://oa.doria.fi/bitstream/handle/10024/2702/holocene.pdf?sequence=1
Bender, #32
The reference is to comments 25 and 26 above. Or are you narrowingly constraining your defence to only material directly canvassed by Mann2008?
Re: DaleC (#35), Ah, thank you. Reply as follows.
Re: bender_teammember (#36),
I respond to you dear Dr. Bender-TeamMember with much trepidation as I am someone who had to learn to read before learning Excel and can barely understand the linear algebra and PC terminology that is flung around this site. You, on the other hand, appear very sure of yourself and the understanding of the material and methodologies at hand.
After years of plotting data (with the aid of my Excel) I have learned a thing or two about interpreting graphs albeit unsophisticated by others standards. When I see the plots of the reconstructions, and only the reconstructions, in the graphs from the paper in question I do not see the conclusion reached by the authors – that the reconstructions show that the warming in the recent decades is unprecedented. I have read that thing about divergence in the latter part of reconstruction time period but I am assuming that it should have no affect on the reconstruction as I see no explanation for it. The bold part of the graph that contains the instrumental record is a nice reference and I appreciate the team of authors putting it there very boldly for reference, but my years of graph reading have taught me that such insertions are just that and not to be confused with the story that the main graph is showing, i.e. the entire period of the reconstruction.
With hat in hand and head deeply bowed I await the insightful answer/explanation one would, no make that should, anticipate from a person of your apparent intellect and knowledge. I like your hyphenated name and you seem so cool I cannot determine whether Bender or TeamMember is your mate’s former last name or yours.
Re: Kenneth Fritsch (#38), says:
Happy to reply.
Re: bender_teammember (#42),
Dr. Ben (I am wont to call you Ben because it seems I have known you longer than a 2 post exchange) I must defer to your obvious superior intellect and knowledge base on this one and admit that this humble soul was reading something into the conclusion or comments made in Mann et al. (2008). As penance for my obvious transgression, I have reread the paper and diligently excerpted comments that are relevant to the point that you are obviously making. My only excuse for my overreaching was my memory of the bad old days of the HS and temporarily forgetting that that was before the team got religion.
From page 13257, Mann et al. (2008): “Given the uncertainties, the SH and global reconstructions are compatible with the possibility of warmth similar to the most recent decade during brief intervals of the past 1,500 years”.
So we are right back were we started before the HS and it would appear we can conclude nothing. I think perhaps that is why Steve M continues to look at the methodologies and not the conclusion in this paper.
From page 13257, Mann et al. (2008): “Our results extend previous conclusions that recent Northern Hemisphere surface temperature increases are likely anomalous in a long-term context. Recent warmth appears anomalous for at least the past 1,300 years whether or not tree-ring data are used. If tree-ring data are used, the conclusion can be extended to at least the past 1,700 years, but with additional strong caveats.”
I was too general in my claim of “unprecedented” as it must be modified by restricting it to the NH and for the last 1300 years and maybe for the last 1700 years and only by comparing it to an inserted instrumental record. I think that makes the above excerpted statement, that appears in the introduction and not the conclusions of the paper, probably meant to be a hypothetical by the authors and as contingent on accepting the inserted instrumental record as a splice onto the reconstruction. We know that it is not a splice as the lead author of this paper has stated previously that they did not and do not use splices of the instrumental records to the reconstruction in these graphs, i.e. the instrumental insertion is kind of floated there and the viewer can use their imagination to fit it – given the authors suggested/preferred placement.
From page 13255, Mann et al. (2008): “Peak Medieval warmth (from roughly A.D. 950-1100) is more pronounced in the EIV reconstructions (particularly for the land only reconstruction) than in the CPS reconstructions (Fig. 3). The EIV land-only reconstruction, in fact, indicates markedly more sustained periods of warmer NH land temperatures from A.D. 700 to the mid-fifteenth century than previous published reconstructions. Peak multidecadal warmth centered at A.D. 960 (representing average conditions over A.D. 940–980) in this case corresponds approximately to 1980 levels (representing average conditions over 1960–2000). However, as noted earlier, the most recent decadal warmth exceeds the peak reconstructed decadal warmth, taking into account the uncertainties in the reconstructions.”
Again the authors here are assuming the reader fully understands that that last sentence is a hypothetical based on a favorable instrumental splice that isn’t really a splice and, of course, on the hypothetical of using the divergence of the reconstruction from the instrumental record in the most recent part of the reconstruction as reason (or excuse) to insert boldly the instrumental record. The reader needs to read elsewhere in the paper that the authors imply a preference for the historically warmer EIV reconstruction over that of the CPS. All of this is in line with Dr. Ben’s admonition to read the paper, reread it and than read it again.
Dr Ben, again thanks for getting me untracked from thinking that this paper firmly concludes differences between recent and past temperatures and allowing me to fully realize why Steve M is looking at methodologies and not any vague or insinuated conclusions.
Re: Kenneth Fritsch (#56),
Dear Mr. Fritsch,
From now on I will use the name you suggested.
Thank you for your diligence in rereading the paper and in recognizing that the claims in this paper are much more modest than in MBH98. For the record, I found your earlier review to be fair and concise. You are correct that the claims in this paper are quite modest. If only everyone on this blog took the care to read the paper the way you did.
As for Mr. McIntyre’s so-called “audit”, I am confident that he will find that our conclusions are sufficiently modest as to be highly robust to the deletion of any one series. As the SI indicates, reconstruction robustness was tested rather throroughly. He will uncover small, inconsequential errors, no doubt. And for that minor service he is to be thanked. However nothing he finds will substantively alter the paper’s conclusions.
As for “unprecedentedness”. Current global temperatures are clearly very near those in the distant, anomalously warm past. If they are not unprecedented now it is quite possible, nay, probable, that they soon will be. But this is not a paleoclimatological projection; it is a matter of physical modeling. Please visit the site RealClimate to learn more about factual basis underlying GHG-caused climatic trends, as predicted by numerous models of all sorts.
Thank you for your continued interest in team work.
Re: Ben (#59),
Dr Ben, when you say
“As for “unprecedentedness”. Current global temperatures are clearly very near those in the distant, anomalously warm past. If they are not unprecedented now it is quite possible, nay, probable, that they soon will be. But this is not a paleoclimatological projection; it is a matter of physical modeling. Please visit the site RealClimate to learn more about factual basis underlying GHG-caused climatic trends, as predicted by numerous models of all sorts.”
I think I have become sufficiently astute from your tutoring me in the ways of the Team to realize that it is time to leave the reconstructions and move on to the climate models.
I know they have talked at RC about chaotic content of the single realization of the actual climate when compared to climate model results and how difficult that makes comparing an ensemble average with SEMs to the observed climate — ranges are preferred. I am sure my view and anxieties of the unknown, or at least, difficult-to-estimate chaotic content of climate and the resulting uncertainty that puts into the model projections will be clarified with a few doses of the RC elixir. Who knows, they may have progressed (moved on) from the models by the time I comprehend the chaotic content of climate.
Re: Kenneth Fritsch (#60),
You give up too easy. 😉 . At the risk of baiting the cranky bear, the first paragraph of Mann et al. (2008) states
Unless you have a very narrow definition of “unprecedented” (which Dr.Ben admits is possible since he says “If they are not unprecedented now it is quite possible, nay, probable, that they soon will be”), the quote states exactly that. Talk of extending “previous conclusions” (which stated that current temperatures were unprecedented), “recent warmth appears anomalous for at least the past 1,300 years” (or “the past 1,700 years”) doesn’t have a lot of other reasonable interpretations. The circuitous statements still come back to the same end of the stick.
Re: RomanM (#62),
It says nothing of the kind. Please learn to parse more carefully, paying attention to exact words. The authors loaded this paragraph up with caveats, and for good reason. Please learn to read and not just copy and paste.
Those peaks in the early 1400s are very interesting. I am reading a book called 1434 right now, by Gavin Menzies, and it describes a Chinese emporer who, at that time, ordered his admirals to visit the entire known world to notify them of his ascension to the throne. He sent out dozens of fleets in what amounted to thousands of ships. What is fascinating is a Chinese map that dates from this time that shows Hudson’s Bay. According to Chinese records, the Chinese apparently sailed there directly right over the north pole. Alaska, the Bering Straight, Greenland, Europe are all on this map, which pre-dates Columbus. There are European records which corroborate this event, as one of the fleets visited the Pope, and the Vatican has records of everything that ever happened.
I have no idea why historical records are completely disregarded, but this record is a direct match with the peaks on many of those proxy graphs.
Here is a link to the books website 1434
“Vatican has records of everything that ever happened.” err, that ever happened there, at the vatican….
OK, one last, according to the website, the Chinese sailed the Norteast Passage, from Puerto Rico along North America’s East Coast to North of Greenland (just for difficulty), the east North of Siberia, to return to China. In 1421.
How come DaleC’s graphs show a steep drop in proxy average after 2000 while there is no corresponding drop in Mann’s graphs? I realize the number of proxies drops to some too-low number, but are Mann’s charts simply cropped?
Re: Joel McDade (#43) ,
Joel, my charts are of the entire original proxy set (1357 series) from Mann’s own zip at the SI URL. In this version of the data there has been no padding to 1998. My initial intention was to see how many data points had been algorithmically manufactured to bring all the series up to 1998. SteveM is using the padded version of the data, where all series extend (opportunistically?) to 1998, the year of the monster El Nino. A few series actually go to 2003, and they are the ones which drop. My only point, which Bender_team/member/defender has so far refused to address, is that given the rather substantial amount of padding which has happened on many series, and with the number of series so padded increasing more or less linearly from 1970 (the inverse of my number of proxies bar series at post#30 above), how can any reliance be placed on the uptick for the late 20thC? I am expecting bender to defend the strange proposition that the smaller the sample, the more robust the results, because that is what seems to me to be the underlying claim. SteveM pointed out that the Luterbacher series were probably the main contributor to the uptick (and they extend to 2000) so I plotted the averages of everything with and without Luterbacher, and it looks like SteveM is correct. Take Luterbacher out, there is not much of a story left. This is late 20thC only – I am still looking at the differences between 19th versus 20th, and pre WW2 versus post WW2.
Re: DaleC (#45),
Show me the place in the manuscript where this is asserted. You can’t because it isn’t. Stop making things up. Or did you even read the paper? Of course more samples is better than fewer.
Some more confusions. Maybe I’m dense.
Figure S6 of the SI, panel B, appears to have no proxy data past about 1900 (unless it is all perfectly behind the bold instrumental line).
I am totally confused at this point about what data and method combinations are screened for correlation to modern temps and what combos are not. I’m sorta thinking Fig S6 is all proxies (no screening) and Fig 3 in the main paper shows only proxies screened for modern temp correlation.
It doesn’t help that he sometimes has labels in his charts such as, “green = full screened” but this apparently refers to the all-proxy vs. no-dendro comparison.
Arrrg!
Re: Joel McDade (#46), Joel, I’m confused too – that’s why I started with the data version which lives as low down the feeding chain as I could get. My next step is to look at the difference between the memberships of the 1357 and 1209 clubs. It looks like some of the 1357 set are seasonal (like the wang_* set), and so on, but unless I can start with the initial tableau spread before me, I’ll get lost very quickly.
Strange DaleC 48. Visually it appears you have some of the instrumental period shaping your average exc Lu. The data you show past 2000 all appear below the average, and the desity of the data paths are below the average for years 1985- 2003. The outliers +.65 and above starting in about 1930 may be intersting to identify what series they are.
Re: John F. Pittman (#50),
The spaghetti plot does not show it well because of the sheer number of series, but by 2000 90% of the proxies have dropped out – see #30 above – so all sorts of random effects are taking over, including a great plunge at 2003. On the influence of the instrumental record, see SteveM’s comment at #26 above.
I really don’t know how Mann got away with appending the NH HadCrut smoothed temperature data that increases by 1.3C when the actual data increases by only 0.8C – 0.9C.
Of course, this distorts the chart and makes the year 2000, for example, look like it is much warmer than the MWP. If the actual data is used in the chart, current temps look about the same as the MWP.
In other words, NOT the warmest decade in 1,300 years, unless you use a fake current temperature record to compare to.
Re: John Lang (#53), Re the 1.3 Deg C rise in Mann’s plots for CRU. This is the LAND ONLY NH temperature rise (more than land/ocean, or SH or global), which is not plotted at the Hadley site. You have to download the data and plot it yourself. Mann can conveniently eliminate all ocean core data because none of it meets the decadal resolution criteria he uses for dating.
Regarding that Scottish speleotherm. As a native Scot, now blissfully emigrated, I am pretty sure that Scotland has neither a modern warm period nor had it a Medieval warm period. Scotland only barely even has seasons, since it mainly gets what the Atlantic or the North sea dumps on it, ie wind and/or rain. The idea that CO2 could warm the climate by 3rd hand radiation presupposes that the sun penetrates the gray skies in the first place, which it usually doesn’t.
Phew, for a moment there I thought… btw, the new team mascot scares me.
Mark
(Not so “Gentle”) Ben:
The explicit “caveats” in the paragraph refer to the extension to 1700 years.The last sentence in the quote still says that although they will grudgingly admit that (maybe) the stick has a MWP bump and is not as straight as they originally maintained, it was still lower than now. Just what do you think their “previous conclusions” were?
Re: RomanM (#64),
I take this to mean that you are asking me to write out the numerous other implict caveats for you? Maybe you could get a fifth grader to do that for you?
What is “it” in this sentence? Is it GMT or NHMT? Like I said: parse carefully.
Yorick
We had quite a discussion in another thread about the book by Menzies. As a sceptic I would like to believe it, but there are far too many gaps to see it as anything other than an (interesting) work of fiction. However there are lots of other observable pieces of evidence of the MWP. I come across the Met office and Hadley people sometimes and offer to take them up to see nearby Dartmoor (south West England) where the climate changes from Bronze age to the MWP is very well documented and the buildings and fields still observable. No takers as yet.At 1700 feet its still too cold up there to support the life style the earlier settlers experienced.
Tony Brown
Dr. Fritsch clearly understands the carefully chosen language of the abstract. Perhaps he, and a fifth grader of his choosing, can reword it – without changing its substantive meaning – in order to address some of RomanM’s misperceptions?
Hey, how come I don’t rate the “Dr.” appelation? Have some respect!
Last shot. Answer my question: What “previous conclusions” are they referring to? If you’ve read the paper carefully, you should be able to tell me.
Re: RomanM (#65),
Dear Dr. Roman,
You don’t get it, do you?
The authors said that:
In what way do these results not “extend” previous conclusions? They “extend” previous conclusions because they exclude tree-rings and show a somewhat similar result over somewhat similar time scales. IOW – no bcps needed.
“Long-term context” leaves ample wiggle room for this to be 100% true. These results are more modest than those of MBH98, but they do improve upon those of NAS & Wegman.
There are other caveats I could point you to, but you seem to have blinders on. Take a rest and come back at it with fresh eyes.
P.S. Do I get to repeal your doctorate now?
Very curious. This “Ben” fellow sounds like one of the co-authors of the paper, like he has inside knowedge. A bold defender of the Team who won’t use his real name?
Steve: Oh, c’mon. Ben introduced himself a while ago. He’ll be heartened that he sounds like a Team member.
By the way “Ben”, I pointed out in 2005 Math Geology that proxies in most cases have dating error that will tend to smear peaks, thus lowering their magnitude. Any discrete period like the MWP will appear cooler or LIA warmer than actual. Thus drawing conclusions about periods as short as a decade can not be justified by the methods. In addition, I think it likely that error bars in Mann’s paper have been underestimated based on comments by Hu and a post at Briggs site re using interpolated data for regression which inflates the DOF and increases the correlation, thus making overlap of confidence intervals more likely than shown in the paper.
Re: Craig Loehle (#67),
Dear Dr. Loehle,
You say:
This issue was recognized explictly in the manuscript. It is just one of many caveats that leads to a conservative interpretation of the data. But since you are an expert, can you please tell me what these alleged dating errors are on the proxies that were used? Can you prove that the error is sufficient to overturn our results? Looking forward to your published reply on this issue.
Best,
B.
Re: Ben (#69), The citation to my “publication” on the effect of dating error is:
Estimating Climatic Timeseries From Multi-Site Data Afflicted With Dating Error
Journal Mathematical Geology
Publisher Springer Netherlands
ISSN 0882-8121 (Print) 1573-8868 (Online)
Issue Volume 37, Number 2 / February, 2005
DOI 10.1007/s11004-005-1305-6
Pages 127-140
You ask if I can “prove” that this issue affects Mann’s results. This would require examining the non-tree ring proxies individually. In general, radiocarbon dates are only accurate with an error margin of 50 to 100 years (lab error). Other factors can increase this error. Some proxies are fairly precisely dated. So it could be done and in my paper above I demonstrate how much some particular examples of dating error would affect detection of a peak. I would not say that the conclusions of the Mann paper are “conservative” when it is clearly stated that the most recent decades temperature (NH land) is “unprecedented” and especially so in the press releases.
Scientists invest considerable effort choosing their words so as not to be misinterpreted. An abstract is just that. It is not an analysis, it is a highly condensed, manicured summary. If people choose to misinterpret or misrepresent a carefully worded message it is not the fault of the authors. The fact is the results speak for themselves. Rather than endlessly parse the abstract, why not read the paper?
Perhaps Dr. Roman and Dr, Ken would like to try re-writing the abstract in a style suitable for CO2 science? No doubt they will need help getting it right. L’il helpers can be recruited easily, if you know where to look.
Best,
B.
Dear Ben:
In the last paragraph of the introduction, second to last sentence of Mann 08, they write:
Thusly Mann and company offer their fealty, tribute, and respect for the NAS panel. IMHO this is payment for services received back in 2006.
Yet one of the *specific* recommendations was to avoid using bcps as a temperature proxy. Why then did Mann turn right around and use bcps?
This is just another tree-ring circus, more Mann-made global warming nonsense.
Re: Joel McDade – Irate CA Fan (#71),
Dear Joel,
The analysis does not depend sensitively on contributions from of any one series. This has been stated many times now. Links have been provided to the SI that proves this. Maybe you would be less irate if you weren’t in denial? Read the SI. Fact: the bcps don’t matter the way they did in the MBH98 reconstruction. The reason is because the proxy database has been tremendously upgraded, as recommended by NAS. Your suggestion that this is a “tree-ring circus” is unjust. The results do not change susbtantively when the tree-ring data are removed.
Sorry for mistakenly posting this at the wrong thread (Boreholes).
Dr. Ben, please. It is Mr. Ken to you. Your message to those that have been listening and have reread Mann et al. (2008) several times has been loud and clear. As Mr. Ken to Dr. Ben, let me respectfully suggest a good model for what you are attempting to communicate here about what the Mann paper is actually saying and how it is saying it.
We have a concurrent thread at CA on borehole temperature reconstructions where the participants talk about ill conditioned problems (in linear algebra) where small changes in the initial inputs can change the answer very significantly.
http://www.climateaudit.org/?p=3586#comment-295344
What is so remarkable about the Mann paper is that what you take away from it can vary greatly (due, in no small part, to the flexibility the authors provide) depending dramatically on the reader’s starting points. It is a creation of the need to be able to impart the strict scientific result with all the uncertainty that that historically implies and at the same time allow a Gerry North or any other AGW advocate to bring away a message in line with their advocacy. Putting this more specifically, the authors are allowed to scientifically present evidence that the HS is broken and at the same allow others, who so choose, to interpret the paper such that policy implications are not changed. Brilliant. Just brilliant.
Dr. Ben your alluding to 5th graders in no less brilliant in that you impart the true and remarkable extent of the interpretations available from this paper and in this case the 5th grader version. Heck, I would think there could be a 1st grader version also. I know they are good at getting the points of fairy tales.
So what problems with this paper remain and are well-posed? I would suggest that it is the methodologies that Steve M has been analyzing. I would only respectfully submit to you, Dr. Ben are you up to discussing those issues either from your perch on your tall horse or at ground level.
Re: Kenneth Fritsch (#73),
Dear Ken,
You say:
I am sympathetic to your concern. Unfortunately, what policy people make of the paper is pretty much beyond the authors’ control.
As for your other substantive point, I take this as an invitation to pre-review any manuscripts you happen develop on the topic of ill-posedness of the MBH08 robustness test. Sounds like it could be an important contribution to the field.
Best,
B.
Re: Kenneth Fritsch (#73),
Yes, they think they are clever. They used langauge that was (1) as alarmist as possible, (2) as consistent with MBH98 as possible, but (3) was not factually incorrect. They way they did this was to use carefully ambiguous language, laden with hidden caveats that a policy maker would be sure to ignore. If policy makers were to do that, the authors could not be blamed, could they? Hand in glove.
That is why Steve M’s technical work is important. On a textual level this paper appears unassailable – as you revealed in your review.
The single biggest weakness is one I mentioned earlier, which Craig Loehle (#67) echoes, on the MWP “smearing effect” of dating error. The trick is to correctly calculate vertical error bars given horizontal error. I expect that this would increase the possible amplitude of MWP to something significantly greater than the CWP. However this is only a hunch.
People focusing on individual proxies, plotting data etc., are wasting their time, duplicating Steve M’s work but at a far lower level of rigor. The thing to focus on is the smearing effect. What do they say about it? How do they cope with it? Are they in denial about it? Read the paper. Read Loehle’s paper. Compare.
Re: bender (#78),
Bender and Craig Loehle, I would agree, from a layperson’s viewpoint, that the smearing effect is of major importance in analyzing the potential (but obvious) weakness of the reconstruction and methodologies used. I also think that all or at least many of the methodologies involved should be reviewed on a piecemeal schedule with which Steve M appears to be proceeding.
This layperson has a problem with such simple statements describing the screening process for calibration where Mann et al. (2008) uses of a regression p = 0.10, or actually p = 013, if autocorrelation is taken into account, and then in turn attributes that p value to associated absolute r values of 0.11 and 0.34 for annual and decadal resolved records, respectively. As I recall using a p value of that magnitude can result in some very low values of r for the correlation, given a large n, and one has to wonder why one would use the p value and not the r values directly. The corresponding R^2 values of 0.01 and 0.12 for the r values above would indicate to me that only 1 and 12 percent of the variation in the temperature can be explained by proxy response or should that be the other way around?
I am also having problems following and reconciling the confidence limits reported for the calibration/validation process and then the reconstructions that appear to show significantly different confidence limits from each other.
Re: Kenneth Fritsch (#79),
No, you’ve got it right.
Oh, sorry I missed that “Ben” is “Bender” playing devil’s advocate. Great job! The condescension is perfect.
LOL – Very entertaining. Thank you Bender and Ken. Take a bow.
Has anyone looked at the differences between Mann’s “original” proxies as of Sept 5, 2008 and “original” proxies as of Sept 4, 2008?
Re: Steve McIntyre (#81),
Steve, the archive from 4Sep08 has 1357 series, and the archive from 5Sep08 has 1209 series. The extra series in the 4Sep08 archive are things like seasonal breakdowns – for example the wang_* series in the 1357 set have summer, winter, spring and fall, where in the 1209 set there is only annual. I did an exhaustive compare. The full list of series in 1357 but not in the 1209 set is
agrars
aktaars
at1ars
at2ars
bpm_picoars
cerbars
charles_1997_seychellesann
charles_1997_seychellescold
charles_1997_seychelleswarm
cl_pcglars
cole_2000_malindi
dahl_jensen_dye3bh
dahl_jensen_gripbh
evoars
felis_2000_o18cold
felis_2000_o18warm
hkstd
holdsworth_1992_logandelta1
htmars
jabears
jabwars
java
junipars
kars
klingbjer_2003_sweden
krhars
kuhnert_1999_d13ccold
kuhnert_1999_d13cwarm
kuhnert_1999_d18ocold
kuhnert_1999_d18owarm
kur2ars
kurayars
lamb_1977_seoul
linsley_2000_srcacold
linsley_2000_srcawarm
luckman_rcs
lutannt72
lutannt73
lutannt74
lutannt75
lutannt76
lutannt77
lutannt78
lutannt79
lutannt80
lutannt81
lutannt82
lutannt83
lutannt84
lutannt85
lutannt86
lutannt87
lutannt88
lutannt89
lyakhov_1988_russiafall
lyakhov_1988_russiaspring
lyakhov_1988_russiasummer
lyakhov_1988_russiawinter
min_agr_1961_thailand
ml_ukcars
msars
nagars
ngrip_2004_ngreenland
partridge_2005_mdo
partridge_2005_sedflux
qian_2003_schina
qian_2003_yangtze
qs9ars
quinn_1992_elninostrength
quinn_1993_qsr18oann
quinn_1993_qsr18ocold
quinn_1993_qsr18owarm
quinn_1996_espiritu
rcs_chron_908_1998
recjj_yy2
rodrigo_1999_andaluciarainfall
rodrigo_1999_andaluciarainspring
rodrigo_1999_andaluciarainsummer
rodrigo_1999_andaluciarainwinter
schweingruber_mxdabd_grid37
schweingruber_mxdabd_grid43
schweingruber_mxdabd_grid60
schweingruber_mxdabd_grid71
schweingruber_mxdabd_grid72
schweingruber_mxdabd_grid73
schweingruber_mxdabd_grid74
schweingruber_mxdabd_grid80
schweingruber_mxdabd_grid85
schweingruber_mxdabd_grid96
sgh_pialars
sgh_picoars
sgh_psmears
srdsmars
strathcona
suk_1987_koreacold
suk_1987_koreacoldwinter
suk_1987_koreawarm
suk_1987_koreawarmwinter
t10ars
t10jvars
t13ars
t13jvars
t22ars
t22jvars
t24jvars
ta98dcrn
tl_pccglars
tomlars
tsu98ars
ugboars
uglaars
ulagars
urban_2000_d18oann
urban_2000_d18ocold
urban_2000_d18owarm
vamars
vchars
villalba_1996
w3crn
w42crn
wang_1990_eastchinafall
wang_1990_eastchinaspring
wang_1990_eastchinasummer
wang_1990_eastchinawinter
wang_1991_chinafall
wang_1991_chinaspring
wang_1991_chinasummer
wang_1991_chinawinter
wang_1991_northchinafall
wang_1991_northchinaspring
wang_1991_northchinasummer
wang_1991_northchinawinter
ya11lars
ya12lars
ya15lars
yak4lars
yak7pars
yak8lars
yak9lars
yakutia
yamal2002
zinke_2004_12c13ccold
zinke_2004_12c13cwarm
zinke_2004_16o18ocold
zinke_2004_16o18owarm
zinke_2004_srcaann
zinke_2004_srcacold
zinke_2004_srcawarm
I wonder why some Schweingruber series are included and others are not; ot why some Luterbachers are excluded. Lots of Mannian rabbit-holes.
Re: Steve McIntyre (#83), Well, as I have been saying for over 2 years, you can’t cherry-pick your samples according to what the answer “should be” in real science. snip
Steve: I don’t know why these particular series were excluded yet. Unless you’ve studied the data, it’s premature to jump to conclusions on why they were excluded and accomplishes little at this stage.
Just think what the scientific community would think if I published an article showing that formaldehyde was good for you, by deciding to screen studies to admit only the ones that show that morbidity is negatively correlated to formaldehyde exposure. I would get laughed off the planet. snip
Steve: let’s ease off the piling on. This sort of point has been made lots of times.
Re: Long Term Persistence in proxies. LTP has been discussed in the Koutsoyiannis threads relative to models and climate data and also relative to proxies. There are ways that LTP can occur as an artifact, not related to weather LTP. For example, bottom sediments when perturbed by wave action or animals will be an average of the sediments from a window of time, a sort of moving average, and will show LTP for this reason. When pollen data is used from lake samples, the pollen composition is interpreted in terms of the plant species present. When the climate changes, however, the plant community does not instantly adjust (like perhaps plankton do) but gradually changes as new species move in and old plants die. This can take hundreds of years. LTP again. In ice cores, surface melt can penetrate into lower layers that have not yet become solid ice. And so on.
Re: Craig Loehle (#86), I forgot to mention, that in these case of LTP the proxy will NOT show decadal scale climate fluctuations very clearly if at all. Thus they would give the impression of muted response to climate in the past compared to today, especially compared to an instrumental record. That is, such proxies are apples and instrumental data are oranges.
In the final analysis, isn’t Mann 2008 paper converting proxies into temperature itself a proxy for heat? As a proxy for heat temperature varies, sometimes wildly.
I am trying to learn something about temperature proxies. Is there a convenient place to get a definition of the different proxies used by Mann and/or by anyone else? I’m also trying to understand the different types of proxies (tree-ring, coral, ice-core, etc.), including how each measurement relates to temperature. Any recommendations for this novice would be greatly appreciated.
Re: Douglas M. Chatham (#89),
You could try the NAS report. That has a good introduction covering all the main proxy types as well as more detailed analysis of how they are affected by T.
Link
You can get a free download at the link above, but it’s a big file.
Re: Douglas M. Chatham (#89),
Wouldn’t we all? 🙂
Mark
Look, just because you’re insane doesn’t mean you’re a bad person.
Wouldn’t this be the time for CRAIG D. IDSO at CO2 science to release his data/graphs of the MWP, countering Mann,before the next IPCC ?
http://www.co2science.org/articles/V9/N4/EDIT.php
Re: John M Lancaster (#93),
The Idsos don’t do original research (in this area anyway). They find articles in the peer-reviewed literature which show a warm MWP. I don’t expect, therefore, that any journal the IPCC would be interested in would publish such a report, probably claiming it was not original or old news.
Of course if they could come up with some novel statistical technique….
Can Craig Idso at CO2 science release a MWP report with data/graphs of the MWP to counter Mann ? Maybe he will make a move before the next IPCC.
http://www.co2science.org/articles/V9/N4/EDIT.php
Here is a link to the Medieval Warm Period Project
“Dr B”
Brilliant just brilliant. That was Gavin et al to a tee. Tout à fait perfect !!!!
and what entertainment
I’ve just looked at Monckton’s recent paper’s 19 peer-reviewed studies, most since 2000, all of which clearly show the MWP; one even shows the solar correspondences. I then looked at the 41 records here, and not one showed the MWP clearly as all Monckton’s studies do. Silly question I’m sure to old hands, but are both his sets AND Mann’s sets cherry-picking? How can I start to compare these studies (bearing in mind there’s no text book on this)? The mere fact that there IS consistent evidence for the MWP, gathered by many different studies, makes all the noise proxies here look suspect.
Not being a statistician, I just looked at the shapes to see what use they might be to Mann. Visual analysis yielded these interesting groups:
16 Noise
10 Slight MWP
9 Strong / very strong HS (not just Korttajarvi)
3 Slight help to make HS
2 doubtful record
1 Opposes MWP
0 Strong MWP
Seems like noise would help drown out the slight MWP while not drowning the loud HS.