There’s some very important new information related to the “Yamal Substitution” – which sounds like a Ludlum novel title – in the Esper site chronologies which Science provided today. Also see here here here.
Here’s a plot of a 40-year smooth of the Esper site chronology for Polar Urals and Briffa’s archived version of the Yamal substitution (which is in the same general area).
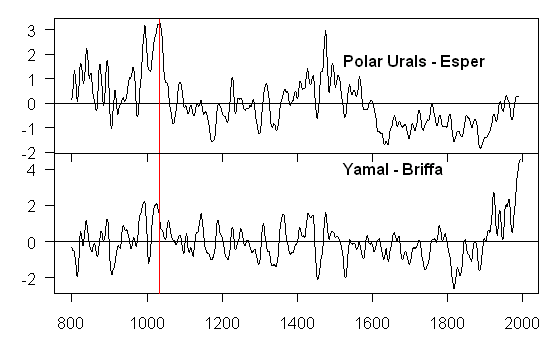
A few months ago, I’d reported that the updated Polar Urals site chronology – if reported by the Hockey Team – would show high MWP values. I showed this recently in connection with Briffa’s switch of the Yamal series for the Polar Urals series in 2000. Now here’s Esper’s calculation which is very similar to my calculation – showing elevated MWP levels.
Now I’m not saying the updated Polar Urals series is “right” and that this proves the MWP. However, I don’t see how anyone can purport to place confidence intervals on the Yamal version or any of its unholy progeny – given that the Polar Urals Update has a completely different MWP-modern relationship.
It is also fascinating to see what happens to 1032 – the “coldest” year of the millennium according to Briffa et al [1995] and the “cold” early 11th century (about which I’ve written a lot). The old Polar Urals series, which was so important in “proving” that the MWP had no patterns. Here, 1032 is in the midst of one of the warmest intervals of the millennium – both in the Esper version and in Briffa’s reprocessing of Yamal. I wonder if Briffa has any plans to send an update to Nature or to anyone else.
I find it extremely objectionable that there was never any formal report on the Polar Urals Update. The Esper version here is the first direct evidence of Hockey Team knowledge of this. In speculative mining businesses, if you have new drill results that change the understanding of an ore body, you have to publish them. Why the hell didn’t Briffa have to publish the updated Polar Urals results, given the big splash that he’d made in Nature about the coldest year of the millennium? It was even mentioned in IPCC 1995.


15 Comments
You know this is good stuff. You’ve made it possible for a layperson to understand.
===================================================================
I am sure there is a reasonable explanation for all this. It is probably something quite simple like the aliens threatening to blow up the planet if Briffa publish.
The twentieth century end of the Esper Polar Urals series actually appears quite reasonable relative to reliable measurements of north polar temperatures. The latter show temperatures increasing until the 1930’s, then decreasing until the late 1970’s and finally increasing again to reach about the same level at the turn of the century as they were in the 1930’s. Although it is a bit hard to tell from the graphic, this looks like the Esper series. The Esper series also looks good relative to usual measurements of the LIA. It appears to reach a trough in the early to mid 1600s, then rise again before reaching a new trough around 1850. All this makes one wonder greatly about the Briffa series. Are the trees in the two series the same? Do they have different responses to CO2 fertilization by any chance? Are they at different elevations? What do we know about Yamal versus the Polar Urals locations?
snip
Q, I don’t think climate modeling programs include your factors, yet.
======================================================================
When you claim to have caught the greased pig of climate prediction you ought to be able to at least show the porker in your hands. What have they got? Greasy palms.
=====================================================================================
Shame on you for describing only half truths Steve.
I gave you clear statistical reasons (related to variance changes through time) why we (DWJ2006) used the Yamal series for the RCS generated reconstruction.
I would have preferred to have processed the Yamal data myself, but like you, was not able to acquire the raw data. The Briffa2000 Yamal data was simply the optimal data-set at the time we did our analysis.
A related question (peripherally, but I don’t know where to post this). Where on this site is the graph of the MBH98 results with the analysis and data errors corrected, showing a much warmer 14th century? I can’t find it.
Help?
Also, Rob, thanks for posting, but I fear I didn’t understand your post.
First, if you couldn’t get the raw data … couldn’t that be construed as a clue as to whether you should include the processed results of that mystery data in a scientific paper? It makes the study unreplicatable …
Second, why was the Yamal data-set “optimal”? You mention it is for “clear statistical reasons” … but since as you say, you could not get the raw data, how on earth did you obtain the clear statistics?
w.
Re: Willis Eschenbach (#8),
Dodge of Willis’s second question noted.
Rob, A couple of posts ago, in More on Yamal Subsitution, I referred already to your email as follows:
First, since you’d sent me this argument offline and because you’ve always been cordial, I didn’t want to present the graphic, but I’ll post it up to better represent your argument.
Second, I don’t necessarily agree with your statistical arguments. If you’re relying on some fairly subtle statistical arguments to justify a substitution that, as you agree, has a significant impact on the final results, then it would be nice if these methods were actually mentioned in the article or its SI. In this case, they weren’t. However, I’m happy to present your side of the argument.
In this particular post, I make no reference to decisions made in D’Arrigo et al 2006, but limit my comments entirely to Briffa’s substitution. There’s no evidence that Briffa relied on a statistical analysis of the type that you carried out.
I apologize if the net result of these posts has not accurately reflected your position; I usually bend over backwards, verging on pedantic, in my statement of positions that I’m criticizing, including detailed quotes and actual graphics. The only reason for not doing so here was that you’d sent me the graphic offline, but I’ll redress the situation forthwith. Cheers, Steve
For others, I wish to emphasize that Rob Wilson is an earnest and serious researcher, who, aside from that, has been consistently civil and gracious with his time with me. However, he did not make all the decisions in respect to D’Arrigo et al 2006. I think that I am entitled to criticize those decisions as eventually published. Readers should understand that Rob disagreed with some decisions (e.g. archiving) and keep that in mind in my discussions of this article.
Re: #7. I for one would be glad to hear your reasoning. It seems to me that homogeneity assumptions are critical to the whole reconstruction enterprise – that the statistical relationships during the calibration period hold throughout the entire reconstructed period. While I can understand selection on the basis of the statistics of the calibration period (e.g. correlation with temperature) and I know there are characteristics such as coherence that might be operative during the reconstructed period (though all problematic). You have warned of reliance on use of such statistics as coherence to prove provenance (in Violins and Climate) so have thought about them a lot no doubt. I would just be very interested in hearing more. Regards.
This makes such a strong case that how you select your proxies for analysis is key. Two tree sites in the same area, giving such different results.
I am really struck by the argument that the “statistical properties” of the series can determine which site you choose. This seems difficult for me; if you are choosing the proxy as a measure of temperature, it is their relationship with temperature which is all important, and the temperature record will have its own idiosyncratic statistical properties (which you don’t know). The issue is whether the proxy informs about temperature, not statistical property.
Likewise, tree records must truly be informative about temperature. If some go randomly up, some go randomly down, choosing a few series which go in the same random direction as temperature over a short period isn’t necessarily going to be informative elsewhere. I can see this issue could be difficult, because you could argue that some tree series are temperature-sensitive, while others are not. But you need to have an objective, pre-hoc definition, not post-hoc analysis.
Certainly, choosing one site over the other seems to be arbitrary. But there is at least as big a can of worms in trying to resolve why there is so much difference between the two tree series; and this must surely open to question whether the series are valid temperature proxies.
cheers
per
Re: per (#11),
It’s amazing how straightforward this concept is for non-climate scientists, while climate scientists don’t get it at all.
Re: Steve McIntyre (#14),
in my experience, a few hair-raising Monte Carlo exercises with absolutely random data sets usually knocks the “pretest sillies” out of almost every student, at least as far as what they know goes. Whether they will resist the temptation to sin is quite another story. The publication pressure gets worse every year, and there’s almost nothing easier to hide than pretesting. Personally, I think a lot of young scholars get very bad incentives (quantity versus quality) and it gets worse all the time.
Per – I’ve posted up Rob’s graphic on variance stabilization. I disagree that this proves what he wants. Also that the issue even exists raises and even neatly summarizes the entire quandary (as you point out.)
One Trackback
[…] did not actually obtain the Yamal data set from Briffa. CA reader Willis Eschenbach at the time asked the obvious question how they knew that this was the “optimal data-set” if they didn’t have the data. […]