Mann and Emanuel 2006 presents an interesting alliance of Emanuel with Michael "I am not a statistician" Mann to carry out calculations purportedly "using a formal statistical analysis to separate the estimated influences of anthropogenic climate change from possible natural cyclical influences". It will come as little surprise to readers of this blog that there appears to some hair on this particular article. Here’s something that I noticed in a first read.
Here is their Figure 1a.
T(t) is the "net SST variability T(t) is represented using the tropical Atlantic HadISST2 observational SST dataset [Rayner et al., 2003]. The SST data from 1870 to 2004 are averaged over the season most relevant to tropical cyclone formation (August-September-October, or ASO), and over the main development region (MDR) of 6⸭18⹎, 20⸭60⹗. "
"G(t) represents global mean SST over the same ASO seasonal window and time interval. "
R(t) are the residuals.
Intuitively one expects the variability in the tropics to be less than in the extratropics – this is certainly what one observes in their Figure 1a, which shows that tropical Atlantic regional SST has gone up less than global SST. Since global SST is a weighted average of tropical SST and extratropical SST (and Christy’s satellite data show a tight coupling of all 6 tropical SST basins), it is hardly surprising that there is a substantial correlation between global SST and tropical Atlantic SST. Mann and Emanuel report that a regression of tropical Atlantic T(t) on global SST G(t) has a coefficient yields the following:
T[t) = 0.93 G(t) + R(t)
and that this relationship "resolves 70 percent of the decadal variance and roughly two thirds of the net warming in T(t)". Mann-speak is always a bit tricky, but "resolved variance" here is probably Mann-speak for r2. The coefficient of 0.93 implies that the tropical Atlantic SST goes up a little bit less than global SST – a result that is intuitively unsurprising.
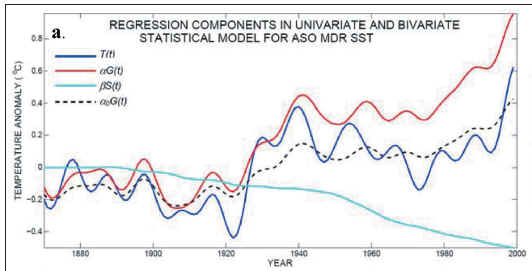
Mann and Emanuel 2006 Figure 1a.
Now Mann and Emanuel observe that the residuals from this relationship have significant autocorrelation. Again this is unsurprising. If you did the same exercise using VZ data, you would get a similar result. The regression here is not a regression of effect against cause. To the extent that both series are both forced in some fashion, autocorrelated residuals are what you’d expect. However, in this case, Mann argues that he can get rid of the autocorrelation by introducing aerosol forcing.
To represent potential enhancement of ASO tropospheric aerosol cooling over the MDR, the estimated Northern Hemisphere anthropogenic tropospheric aerosol forcing series available through 1999 [Crowley, 2000] was included as an additional predictor S(t):
Regression of tropical Atlantic SST against both global SST and Crowley aerosols yielded an equation:
T(t) = 1.7 * G(t) + 0.79 * S(t) +R(t)
The coefficient is now greater than 1 – which they report as "implying a projection of global warming onto the MDR (Figure 1a) that is significantly greater than the global mean". A "projection of global warming" – has to be Mann-speak. The new model is said to "resolve 85.5 percent of the decadal variance" – up from 70% and the autocorrelated residuals are gone.
But think about what this says: Mann and Emanuel conclude that the true temperature increase in tropical Atlantic SSTs should
actually be significantly greater than the increase in global SST and that the observed values have been damped by aerosol forcing. Actually not just aerosol forcing but "enhanced aerosol forcing". They say:
Model estimates [Hansen et al., 2005] indicate that this forcing is especially pronounced over the MDR during the crucial ASO season wherein the net estimated cooling is 1.12⹃, while the global mean ASO cooling is 0.71⹃, indicating a regional enhancement of –0.41⹃ for the MDR.
Now let’s think about the comments of the Georgia Tech students about Climate Audit – "rudimentary statistical analysis" with no attempt at physical understanding. Hey, I agree that most of the statistical analysis done here is rudimentary – had originating paleoclimate authors adequately performed such analysis, we wouldn’t have so many amusing exercises here. I submit that this toy regression in Mann and Emanuel 2006 qualifies as "rudimentary" statistics. I’m sure that Jean S or UC’s hair will curl when they look at this. It’s actually worse that rudimentary statistics since, as so often in these articles, it gives a false assurance that a "formal" statistical analysis has been done.
As to physical interpretation – I don’t purport to be qualified to make physical interpretations of these results and generally avoid doing so. However, I’m going to make an exception here. I think that it’s quite possible that increases in regional tropical Atlantic SST are less than global SST because the region is in the tropics and not because of aerosol forcing. Thus the introduction of aerosol forcing to explain the lower rate of temperature increase in this sector is simply irrelevant and the entire statistical analysis of Mann and Emanuel 2006 to this point is a crock. Over to you, Georgia Tech.
Update: Here is a graphic showing standard deviations by gridcell for the von Storch-Zorita Echo-G model (the graphic is my collation from original output.) You will see that the standard deviation in Mann’s MDR (Main Development Region) is rather low. Thus any conclusion from a "formal statistical" study purporting to show that variability in this region is especially great – and damped by sulphate emissions is rather suspect.


34 Comments
Is that graph of the actual data used?
It looks heavily smoothed. As such, autocorrelation will be an even less surprising feature of the data. I have to say, there is something that makes my hair stand on end whenever I see people smoothing data before they run regressions. The point of running a regression is to tease out the relationships that may not be apparent to the naked eye – smoothing is for graphs, not regressions. I will have to dust off a textbook – but my impression would be that smoothing merely serves to inflate apparent significance. Perhaps Jean S or Steve can explain to me why everyone seems to be smoothing the data before they run regressions and why it’s OK.
The other thing that strikes me about the graph is that those series are about as stationary as a toddler on speed. Did they test to see that the residuals of the aerosol regression are stationary – and thereby, that this isn’t but another spurious regression?
Hi Steve,
Your Hurricane Data Compilation thread is already off my RSS feed and getting pretty far down on this month’s posts.
Suggestion: Create a new “Data Compilation Threads” category on the right menu of the blog, with Hurricane Data as a sub item.
Or whatever. The point being these data might be needed well into the future. You don’t want them buried in the October Archive of threads.
Best Regards.
Steve, GA TECH is not worth worrying about one way or another. Sheesh.
I am intrigued by the inference of "aerosol forcing" to produce a cooling in the tropics, apparently to resolve a difference of temperature variation between the tropics and the extratropics (which as Steve points out, may not be necessary).
It does not appear that Mann has done any work producing evidence that such extra aerosols exist, nor their source. The tropics are not known to have significantly higher amounts of aerosols by any experimental evidence I am aware of, other than the (temporary) inputs from equatorial volcanic eruptions.
If Mann and Emmanuel’s analysis was even slightly true, it would point to a Factor X which is cooling the tropics. It disturbs me constantly in the Bizarre World of Cimate Modelling that not only are parameters added to explain effects but by some magical sixth sense, the modeller knows exactly what they are. That is a delusion, but a delusion so widespread that it sails through peer review without a second thought.
Steve, I am not convinced by the M/E study that there is no AMO effect in the MDR, I have stated this numerous times. Re aerosols, there are two relevant issues in my mind. The first is the northern hemisphere sulfate pollution that was particularly high in the 50’s and 60’s. There is no reason to think that this pollution aerosol should be especially high over the MDR (I haven’t looked at the Hansen paper that found high aerosol concentrations in this region). The main aerosol isue in the MDR is Saharan Dust. Chris Velden has been looking at the impact of Saharan Dust on hurricanes, and finds some evidence of suppression. If Saharan dust was more active during this period, then it could be impacting SST and hurricanes (note the impact on hurricanes is mainly increase static stability, and also probably some effect on cloud nucleation). Not sure however why there was more saharan dust during this period, but this certainly does vary with surface moisture, etc. It is possible, even likely, that Hansen is including desert dust in his analysis. This whole saharan dust thing is interesting and needs more investigation. In any event, it would have been nice if M/E included more discussion of what was physically going on with the aerosols
I live in Billings Montana. This spring we had a lot of haze in the sky. . In the winter many people have wood burning stoves. In the summer the forest fire season begins. Normally, we have a period in late April and May where the mountains 60 miles away appear very clear. This year the haze did not clear. I have tried to find meteorologists that could answer this question without success. I ran across this web site: http://www-airs.jpl.nasa.gov/News/Features/FeaturesChinaDustStorm/ I believe it is the most probable explanation for all of the haze that we are experiencing. At a minimum it shows that wind currents exist bringing pollution and dust to Montana from China.
In 2002 the “Asian Brown Cloud” was in the news. http://www.intellicast.com/DrDewpoint/Library/1345/ Is this pollution from China, Indonesia, and India enough to have caused cooling in the Southern Hemisphere?
I’ve read estimates that 40% of the mercury deposited in the US comes from pollution in China. Is this true? What percent of the SO2 comes from China? Would someone point me in the right direction for the answers to these questions please?
Thanks,
Jim
Here is a graphic showing standard deviations by gridcell for the von Storch-Zorita Echo-G model (the graphic is my collation from original output.) You will see that the standard deviation in Mann’s MDR (Main Development Region) is rather low. Thus any conclusion from a “formal statistical” study purporting to show that variability in this region is especially great – and damped by sulphate emissions is rather suspect.
Where does that picture come from originally?
What units or materials are being pictured with the different colors?
Thanks Steve M for your analysis of M-E. Just what the doctor ordered to get me through Mann-Speak. I am thinking that there is a crude analogy to saliva here: It can be used for spitting or pre-digesting some difficult to digest items. Thanks for pre-digesting and not spitting.
Perhaps Dr. Curry would be interested in putting the M-E paper and your analysis of it out for GT student discussion. If some are truly trained to think for themselves we might get some posting here on the matter, but, if, for other reasons, that cannot be accomplished, we could use the standard Curry-student interpretive process.
Thanks for editing; I saw it posted without any info, a few minutes ago.
Would people stop asking Judy to have the students analyze papers. They haven’t shown any desire to get into the weeds of the mathematics. And they are pass-fail. Be real. They are taking a fluff course.
Dear Steve,
you’re exactly right. One must be very careful which signals deserve an additional mechanism and which don’t. A different latitude is surely a good enough reason to expect different statistical trends.
Adding aerosols has become a universal answer to explain smaller cooling just like the anthropogenic global warming has become a universal tool to explain everything else about the weather and the climate. There is however very little evidence that these effects are primary in explaining various pieces of data.
All the best
Lubos
I just had what may be an insight re the the saharan dust. On another thread, someone (David?) reminded me of an old paper of Gray’s where he stopped using African rainfall as a predictor at some point, since it was no longer working. Gray’s method uses correlations, and he inferred the physical correlation between African rainfall and hurricanes to be associated with enhanced convection. Variations in African rainfall may also “correlate” with Saharan dust, and may be part of the association that Gray saw and then stopped seeing. Apart from the physics of what is actually going on (which may conceivably be captured in Hansen’s model, I have no idea), I agree that there is inadequate discussion of this whole issue in M/E.
One of our hurricane students may choose to comment on this thread, but this particular group does not have any expertise on the aerosols. One of my colleagues is however an expert on dust, I will check in with her
Judith, I have another puzzle for your students.
I looked at the correlation between hurricane count and sea level pressure. From 1950 (start of database) to 1995, there was a clear, strong correlation between low sea level pressure in the Antilles-to-Maimi region. When the pressure there was low, the hurricane count was high.
Then, from 1995 to 2005, the correlation broke. It no longer holds. Just like with the west Africa rainfall.
(Your students can see this by using the NCEP correlations website – sorry, I don’t know how to post images here, I’m a computer klutz.)
Pielke Sr. has just recently discussed a paper showing a link between African dust and hurricanes. I couldn’t get the paper but the abstract says:
Here’s a link to another paper on SAL and hurricanes. Suppression of deep convection over the tropical North Atlantic by the
Saharan Air Layer
This article was published in GEOPHYSICAL RESEARCH LETTERS, VOL. 32, L09808, doi:10.1029/2004GL022295, 2005 and was written by Sun Wong and Andrew E. Dessler
Earth System Sciences Interdisciplinary Center, University of Maryland, College Park, Maryland, USA
Received 22 December 2004; revised 4 April 2005; accepted 12 April 2005; published 12 May 2005.
Wouldn’t the changes in African rainfall be associated with N-S movements of the ITCZ – which David has commented as being associated with hurricane formation? BTW in some recent proxy articles, N-S movements of the ITCZ are associated with changes in tropical upwelling – the topic of tropical upwelling, which I noticed in the realcliamte critique of Gray, is pretty interesting BTW.
I’m not sure if this story has an associated journal article yet; I found it via a NASA press clips list:
Found here:
-http://www.denverpost.com/news/ci_4401365
Experts are eyeing whether the size of moist-air masses off of Africa is key in the formation of hurricanes.
By Katy Human
Denver Post Staff Writer
Article Last Updated:09/26/2006 08:21:09 PM MDT
——– excerpt—–
“This summer, U.S. and French researchers probed the air over the central African country of Niger for clues to what makes a storm system flare or fizzle.
The mission was “extremely successful,” National Center for Atmospheric Research scientists said Tuesday as they detailed preliminary results.
…. In four weeks, scientists watched as a dozen turbulent air waves traveled across Niger and into the Atlantic.
Giant Mylar balloons carrying weather probes tracked the waves most of the way.
Three of the air waves swelled into hurricanes – Florence, Gordon and Helene.
“We were lucky,” said David Parsons, an NCAR scientist. “I think we got enough (to improve hurricane forecasts).”
Baby hurricanes and atmospheric waves that never grew up differed in their patterns of humid air, he said.
Persistent storms had a band of very moist air – 80 percent humidity or more – stretching up to 6,000 feet. Humid air in the fizzlers reached just 3,000 feet.
The scientists also found that dry air masses sweeping down from the north Atlantic and from Europe could quickly defuse developing storm systems.
…
… a new data-gathering technique works.
The team used 40-foot diameter balloons that floated 12 miles into the sky, drifted with the weather and dropped sophisticated weather probes two to six times a day.
The result was a detailed portrait of the atmosphere, project scientists said, better in some ways than the picture painted by weather satellites.
—- end excerpt —-
RE: #4 – Take for example your typical late Summer massive tropical thunderbumper. The type that piles up to over 40K feet. How much of its energy ever really ends up going poleward versus the idealized models? How much of it gets into the Stratsophere instead of going poleward? The truth is, no one really knows and if they claim they do, they are lying.
RE:#13 – I sense that a better understanding of dust world wide will be a key in terms of climate understanding. Look at the North Pacific and its behavior. It’s odd fits and starts may be related to the Brown Cloud.
Re: # 11
TCO, I think the attempted points made in the asking are a subtle way of commenting on Dr. Curry’s participation here and not on her students — we do not know them. But every time we ask you seem to get a free, not so subtle, poke at them with the pass-fail and fluff remarks. Obviously they will not be goaded into participating here, but if they did decide I would not mind them taking a few free posts to answer you in kind.
http://www.hiaper.ucar.edu/archive/community_survey/HiaperScenarios.html
Check out mission scenario 3.
Re #22: What I found most interesting (and depressing) is that after the research need was identified (in 1989/90) it took fully fifteen years (!) for the new aircraft to be funded, built and put into operation. Presumably that list of backlogged research got a little longer in the process.
RE: #23 – Well, it’ll keep some folks really busy. There is still so much to learn about Spaceship Earth.
Wasn’t someone laughing at someone else a while back when they brought up space dust and its potential impacts? I think it may play a small role in all of this, who knows? its not constant, and may in fact come down in relatively large amounts at times, not evenly distributed across the sphere. I believe the global average was on the order of tons per day.
#23 Steve B,
Now your getting an insite into how government works. Thats record time from my experience. They are to be applauded.
Source: University of Wisconsin-Madison
Date: October 11, 2006
” “People didn’t understand the potential impact of dust until satellites allowed us to see how incredibly expansive these dust storms can be,” says Evan. “Sometimes during the summer, sunsets in Puerto Rico are beautiful because of all the dust in the sky. Well, that dust comes all the way from Africa.””
“”Amato Evan, a researcher at the UW-Madison Cooperative Institute for Meteorological Satellite Studies, has found a surprising link between hurricane frequency in the Atlantic Ocean and dust storms that periodically rise up from the Sahara desert and move west. “”
there’s a photo.
http://www.sciencedaily.com/releases/2006/10/061010022224.htm
Ken,
I agree that my remarks come accross as combative to the students, but that’s not the key point. I have nothing against people taking survey courses. It is just not the same thing as Bender like entities, who are being trained/required to rip into things. It’s not a historiography course, with requirement to do original research. That’s fine. Just realize that when you ask for detailed analysis, that’s not the mode here. Coolio?
What I found more confusing in this paper is the design of the two statistical models. In the first one, the global SST are taken as proxy of large-scale “background large-scale warming, believed to be largely radiatively forced..”. In the second model, an estimation of the aerosol forcing is additionally included. This seems to me inconsistent. Why not take an estimation of the global radiative forcing instead of global SSTs in the first place? This would avoid the problem that in original model the global SSTs, as predictor, already includes the predictand in itself, and also part of the aerosol forcing. Form the physical point of view, using the global radiative forcing would be the logical way to proceed, I think.
But then you lose a degree of fudging freedom. It’s so much more convenient if we can correlate to an intermediate or a forcer as we choose.
#29. When you actually examine what these guys did, it makes your head sore, doesn;t it?
#23 It doesn’t really matter what aircraft was used, or not used. The Mann Emmanel answer would still have been wrong. The bad workman blames his tools.
#6 “I live in Billings Montana. This spring we had a lot of haze in the sky”
As a very well wooded state, maybe the haze is caused by emissions from the trees. These are thought to produce aerosol particles that cause the blueish haze for example over the Smokies.
Speaking of possible natural cyclical influences:
hurricanes-and-winter-snowfall